

Transcriptional Characteristics Showed That miR-144-y/FOXO3 Participates in Embryonic Skin and Feather Follicle Development in Zhedong White Goose
- PMID: 36009690
- PMCID: PMC9405214
- DOI: 10.3390/ani12162099
Transcriptional Characteristics Showed That miR-144-y/FOXO3 Participates in Embryonic Skin and Feather Follicle Development in Zhedong White Goose
Abstract
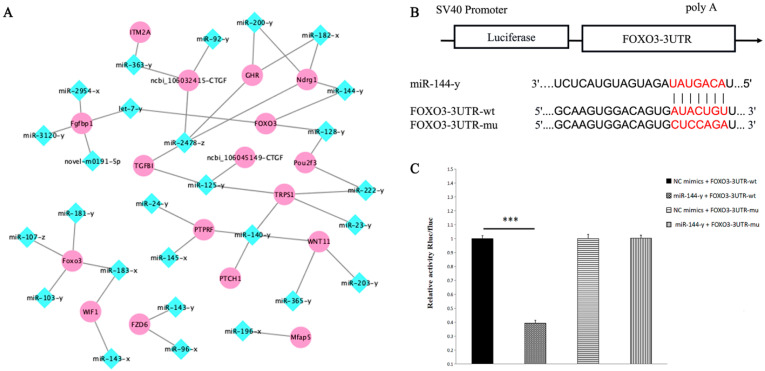
Skin and feather follicle development are essential processes for goose embryonic growth. Transcriptome and next-generation sequencing (NGS) network analyses were performed to improve the genome of Zhedong White goose and discover the critical genes, miRNAs, and pathways involved in goose skin and feather follicle morphogenesis. Sequencing output generated 6,002,591,668 to 8,675,720,319 clean reads from fifteen libraries. There were 1234, 3024, 4416, and 5326 different genes showing differential expression in four stages, E10 vs. E13, E10 vs. E18, E10 vs. E23, and E10 vs. E28, respectively. The differentially expressed genes (DEGs) were found to be implicated in multiple biological processes and pathways associated with feather growth and development, such as the Wnt signaling pathway, cell adhesion molecules, ECM-receptor interaction signaling pathways, and cell cycle and DNA replication pathways, according to functional analysis. In total, 8276 DEGs were assembled into twenty gene profiles with diverse expression patterns. The reliability of transcriptome results was verified by real-time quantitative PCR by selecting seven DEGs and five miRNAs. The localization of forkhead box O3 (FOXO3), connective tissue growth factor (CTGF), protein parched homolog1 (PTCH1), and miR-144-y by in situ hybridization showed spatial-temporal expression patterns and that FOXO3 and miR-144-y have an antagonistic targeting relationship. The correlation coefficient of FOXO3 and miR-144-y was -0.948, showing a strong negative correlation. Dual-luciferase reporter assay results demonstrated that miR-144-y could bind to the expected location to suppress the expression of FOXO3, which supports that there is a targeting relationship between them. The detections in this report will provide critical insight into the complex molecular mechanisms and breeding practices underlying the developmental characteristics of skin and feather follicles in Zhedong white geese.
Keywords: feather follicles development; gene expression; goose; skin; transcriptome sequencing.
Conflict of interest statement
The authors declare no conflict of interest.
Figures


Similar articles
-
Comparative transcriptomic analysis reveals breed-specific developmental characters of skin and feather follicles between Anser Cygnoides and Anser Anser.Poult Sci. 2025 Jun 28;104(10):105457. doi: 10.1016/j.psj.2025.105457. Online ahead of print. Poult Sci. 2025. PMID: 40652766 Free PMC article.
-
Expression of FOXO3 in the skin follicles of goose embryos during embryonic development.Br Poult Sci. 2023 Oct;64(5):586-593. doi: 10.1080/00071668.2023.2226078. Epub 2023 Sep 6. Br Poult Sci. 2023. PMID: 37334805
-
De Novo Transcriptome Sequencing Analysis of Goose (Anser anser) Embryonic Skin and the Identification of Genes Related to Feather Follicle Morphogenesis at Three Stages of Development.Int J Mol Sci. 2018 Oct 15;19(10):3170. doi: 10.3390/ijms19103170. Int J Mol Sci. 2018. PMID: 30326614 Free PMC article.
-
miR-140-y targets TCF4 to regulate the Wnt signaling pathway and promote embryonic feather follicle development in Hungarian white goose.Poult Sci. 2024 Apr;103(4):103508. doi: 10.1016/j.psj.2024.103508. Epub 2024 Feb 3. Poult Sci. 2024. PMID: 38350393 Free PMC article.
-
Exploration of key regulators driving primary feather follicle induction in goose skin.Gene. 2020 Mar 20;731:144338. doi: 10.1016/j.gene.2020.144338. Epub 2020 Jan 7. Gene. 2020. PMID: 31923576
Cited by
-
Molecular Regulatory Mechanisms in Chicken Feather Follicle Morphogenesis.Genes (Basel). 2023 Aug 18;14(8):1646. doi: 10.3390/genes14081646. Genes (Basel). 2023. PMID: 37628697 Free PMC article. Review.
-
Nonlinear model fitting analysis of feather growth and development curves in the embryonic stages of Jilin white geese (Anser cygnoides).J Anim Sci. 2023 Jan 3;101:skac373. doi: 10.1093/jas/skac373. J Anim Sci. 2023. PMID: 36371804 Free PMC article.
-
Identification of Differentially Expressed Genes and microRNAs in the Gray and White Feather Follicles of Shitou Geese.Animals (Basel). 2024 May 20;14(10):1508. doi: 10.3390/ani14101508. Animals (Basel). 2024. PMID: 38791725 Free PMC article.
-
Comparative transcriptomic analysis reveals breed-specific developmental characters of skin and feather follicles between Anser Cygnoides and Anser Anser.Poult Sci. 2025 Jun 28;104(10):105457. doi: 10.1016/j.psj.2025.105457. Online ahead of print. Poult Sci. 2025. PMID: 40652766 Free PMC article.
References
LinkOut - more resources
Full Text Sources
Research Materials
Miscellaneous
