

Influence of Lonicera japonica and Radix Puerariae Crude Extracts on the Fecal Microbiome and Nutrient Apparent Digestibility of Finishing Pigs
- PMID: 36009699
- PMCID: PMC9404931
- DOI: 10.3390/ani12162109
Influence of Lonicera japonica and Radix Puerariae Crude Extracts on the Fecal Microbiome and Nutrient Apparent Digestibility of Finishing Pigs
Abstract
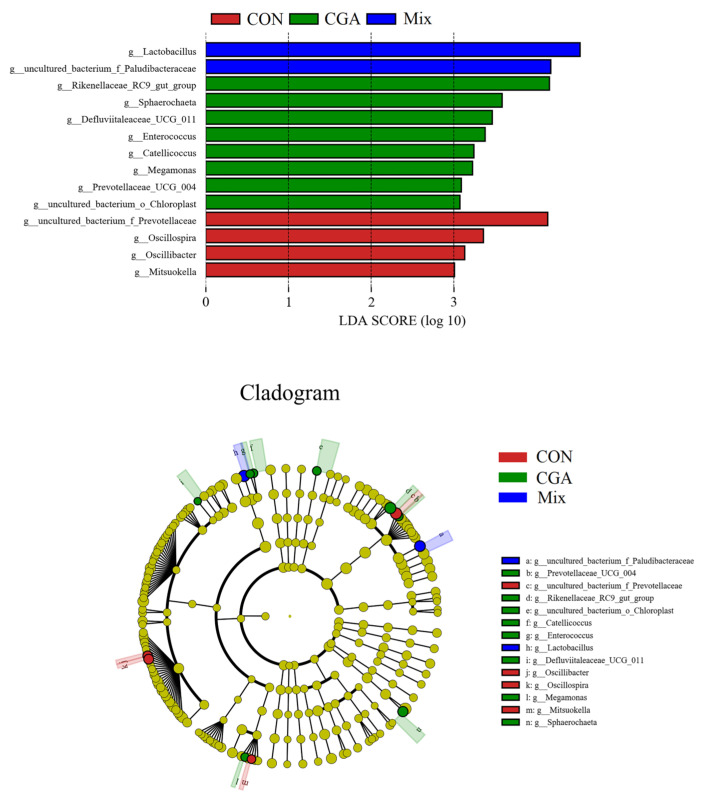
This study aims to investigate the influence of adding Lonicera japonica (L. japonica) and Radix Puerariae crude extracts and their mixture to the diet of finishing pigs on their fecal microbes and nutrient apparent digestibility. A total of 72 healthy Duroc × Landrace × Yorkshire crossbred barrows without significant differences in body weight (93 ± 2 kg) were selected and randomly divided into four groups (18 in each group). Three replicate pens per group (six pigs per pen) were used, and two pigs were evaluated for each pen. The groups were fed the following diets: control group (CON), basic diet; chlorogenic acid group (CGA group), basic diet + 1 kg/ton L. japonica crude extract; Pueraria flavonoid group (PF group), basic diet + 1 kg/ton Radix Puerariae crude extract; and mix group (Mix group), basic diet + 0.5 kg/ton L. japonica crude extract + 0.5 kg/ton Radix Puerariae crude extract. The following results were obtained: (1) At the phylum level, Bacteroidetes, Firmicutes, Spirochaetes, Proteobacteria, Fibrobaeteres, and Kiritimatiellaeota were the main components of the fecal microbiota (top 5); the relative abundance of bacteria from phyla Firmicutes significantly increased in the Mix group than in the CON group (p < 0.05). At the genus level, Treponema_2, Rikenellaceae_RC9_gut_group, uncultured_bacterium_f_Lachnospiraceae, uncultured_bacterium_f_Prevotellaceae, and Prevotellaceae_NK3B31_group were the main components of the fecal microbiota (top 5); the relative abundance of bacteria from genus Lactobacillus significantly increased in the Mix group than in the CON group (p < 0.05). Chao1 and Ace counts were significantly higher in group CGA than in the CON group and group Mix (p < 0.05). The alpha and beta diversities and the relative abundance of fecal microbes were higher in all test groups than in the CON group. (2) The protein digestibility was significantly higher in the CGA and PF groups than in the CON group, and the TP digestibility was significantly higher in the CGA than in the CON and Mix groups (p < 0.05). In conclusion, Lonicera japonica and Radix Puerariae crude extract supplementation in the diet significantly changed fecal microbiota and improved the protein and TP digestibility of finishing pigs.
Keywords: Lonicera japonica crude extracts; Radix Puerariae crude extracts; feces microbiota; finishing pigs; nutrient apparent digestibility.
Conflict of interest statement
The authors declare no conflict of interest.
Figures


Similar articles
-
Effects of Fructus Aurantii Extract on Growth Performance, Nutrient Apparent Digestibility, Serum Parameters, and Fecal Microbiota in Finishing Pigs.Animals (Basel). 2024 Dec 17;14(24):3646. doi: 10.3390/ani14243646. Animals (Basel). 2024. PMID: 39765550 Free PMC article.
-
Effects of dietary supplementation of compound enzymes on performance, nutrient digestibility, serum antioxidant status, immunoglobulins, intestinal morphology and microbiota community in weaned pigs.Arch Anim Nutr. 2021 Feb;75(1):31-47. doi: 10.1080/1745039X.2020.1852008. Epub 2020 Dec 15. Arch Anim Nutr. 2021. PMID: 33317350
-
The Effect of Black Pepper (Piperine) Extract Supplementation on Growth Performance, Nutrient Digestibility, Fecal Microbial, Fecal Gas Emission, and Meat Quality of Finishing Pigs.Animals (Basel). 2020 Oct 25;10(11):1965. doi: 10.3390/ani10111965. Animals (Basel). 2020. PMID: 33113842 Free PMC article.
-
Effect of mixed meal replacement of soybean meal on growth performance, nutrient apparent digestibility, and gut microbiota of finishing pigs.Front Vet Sci. 2024 Feb 1;11:1321486. doi: 10.3389/fvets.2024.1321486. eCollection 2024. Front Vet Sci. 2024. PMID: 38362303 Free PMC article.
-
Potential Application of Lonicera japonica Extracts in Animal Production: From the Perspective of Intestinal Health.Front Microbiol. 2021 Aug 9;12:719877. doi: 10.3389/fmicb.2021.719877. eCollection 2021. Front Microbiol. 2021. PMID: 34434181 Free PMC article. Review.
Cited by
-
Effects of Fructus Aurantii Extract on Growth Performance, Nutrient Apparent Digestibility, Serum Parameters, and Fecal Microbiota in Finishing Pigs.Animals (Basel). 2024 Dec 17;14(24):3646. doi: 10.3390/ani14243646. Animals (Basel). 2024. PMID: 39765550 Free PMC article.
-
Effects of Pueraria extracts on growth performance, immune function, and immune-related gene expression of Wuzhishan piglets.Front Vet Sci. 2025 May 30;12:1491130. doi: 10.3389/fvets.2025.1491130. eCollection 2025. Front Vet Sci. 2025. PMID: 40520430 Free PMC article.
References
Grants and funding
LinkOut - more resources
Full Text Sources
Research Materials
Miscellaneous
