. 2022 Jul 29;11(8):1139.
doi: 10.3390/biology11081139.

Expression of Exogenous GFP- CesA6 in Tobacco Enhances Cell Wall Biosynthesis and Biomass Production

Affiliations

Expression of Exogenous GFP- CesA6 in Tobacco Enhances Cell Wall Biosynthesis and Biomass Production

Monica De Caroli et al. Biology (Basel). .

Abstract

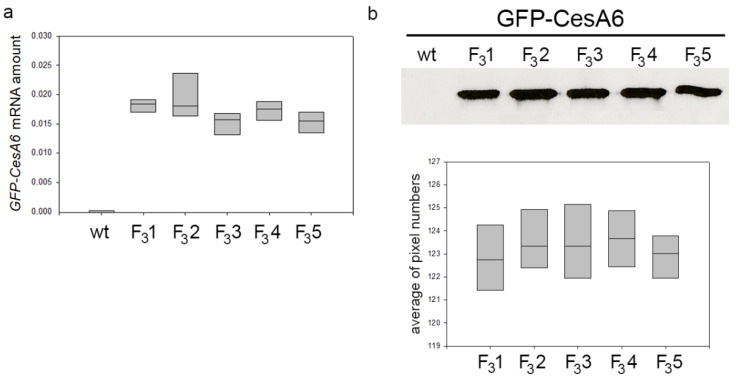
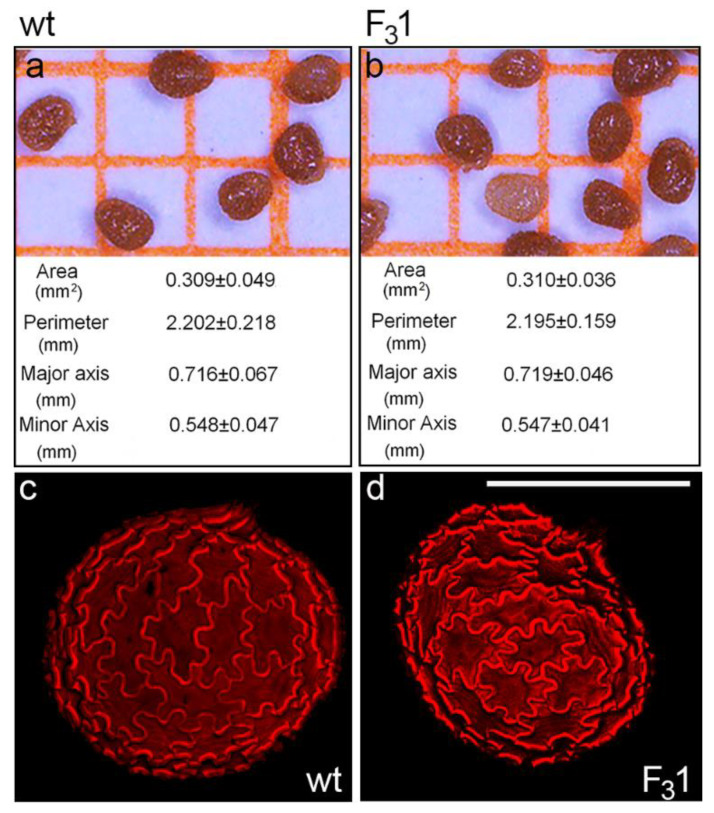
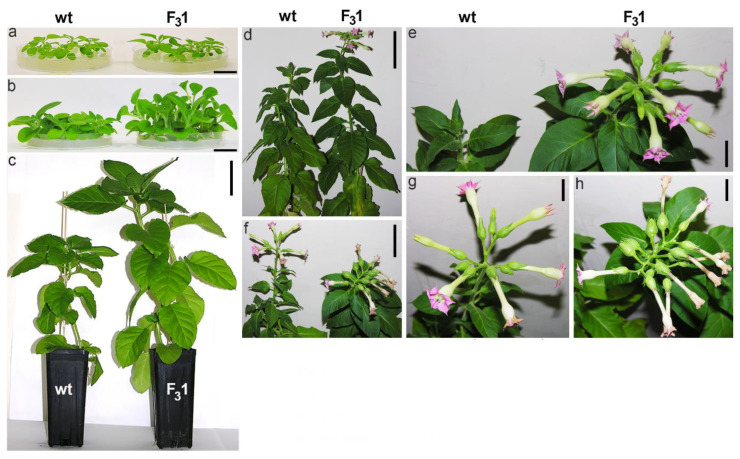
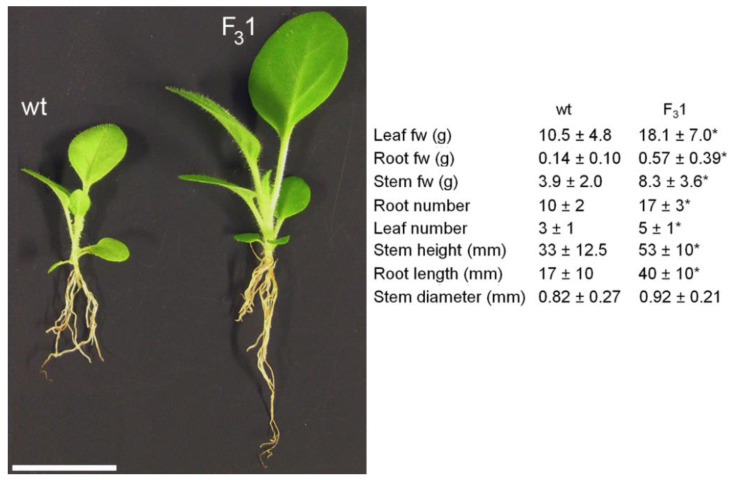
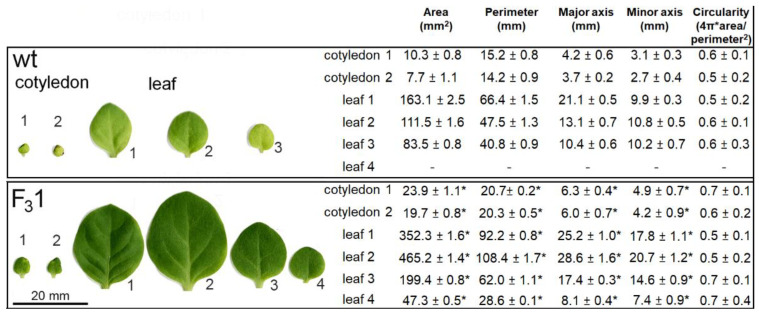
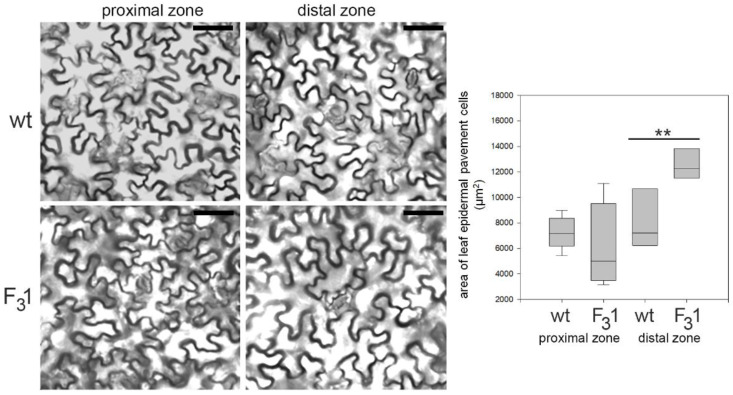
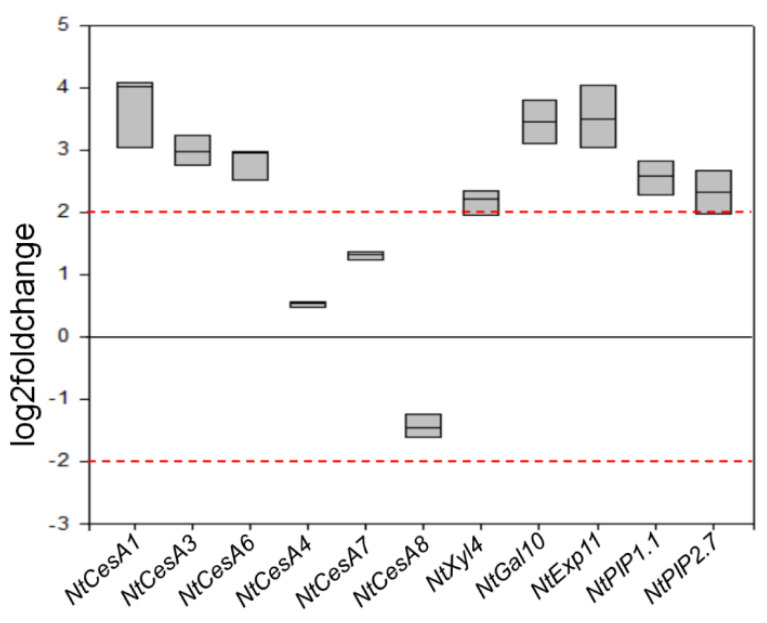
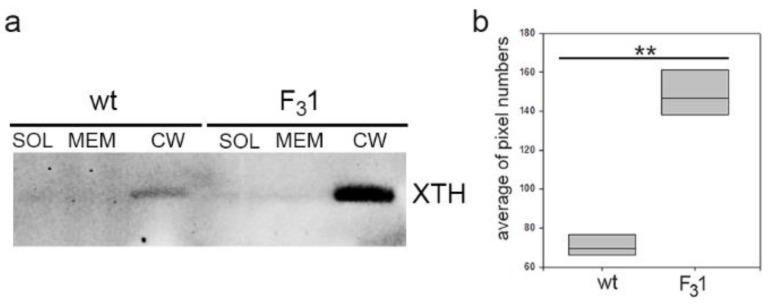
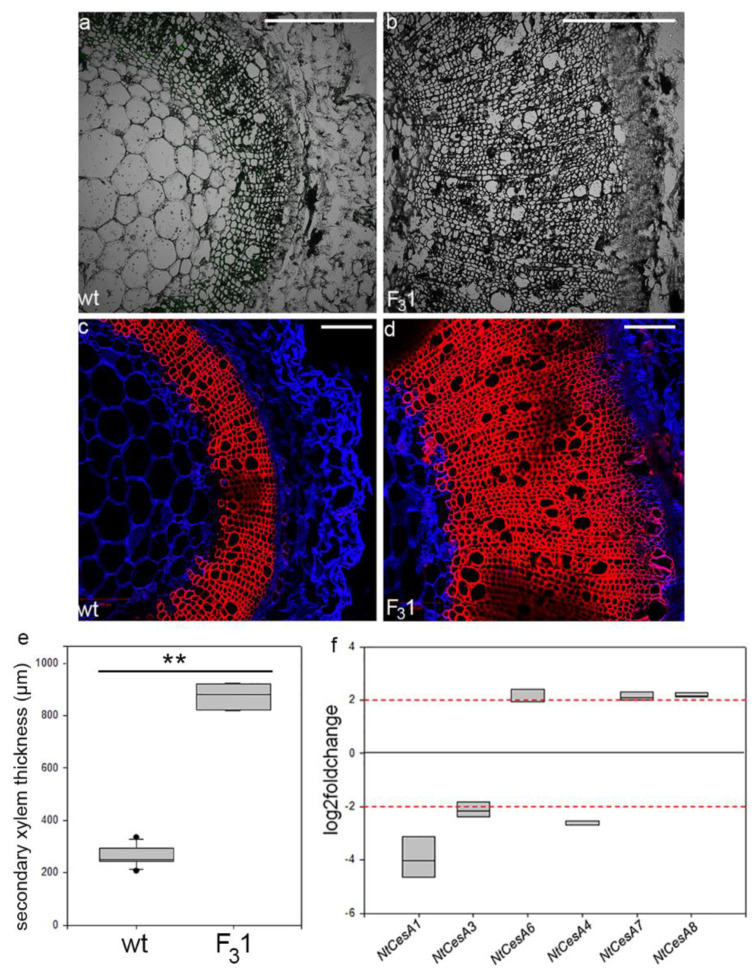
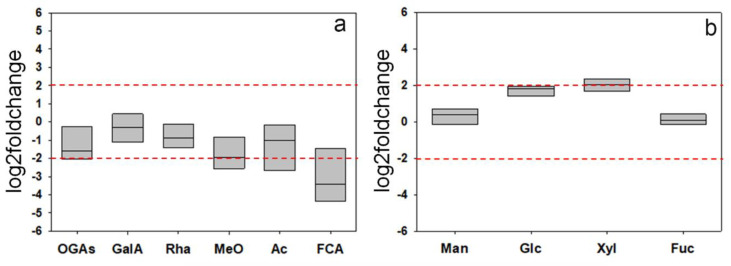
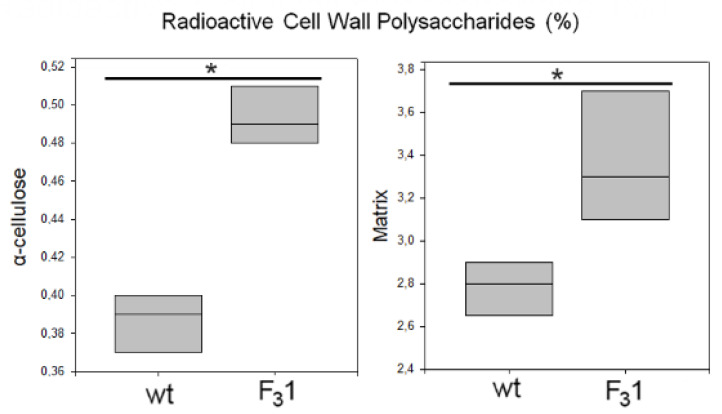
Improved cellulose biosynthesis and plant biomass represent important economic targets for several biotechnological applications including bioenergy and biofuel production. The attempts to increase the biosynthesis of cellulose by overexpressing CesAs proteins, components of the cellulose synthase complex, has not always produced consistent results. Analyses of morphological and molecular data and of the chemical composition of cell walls showed that tobacco plants (F31 line), stably expressing the Arabidopsis CesA6 fused to GFP, exhibits a "giant" phenotype with no apparent other morphological aberrations. In the F31 line, all evaluated growth parameters, such as stem and root length, leaf size, and lignified secondary xylem, were significantly higher than in wt. Furthermore, F31 line exhibited increased flower and seed number, and an advance of about 20 days in the anthesis. In the leaves of F31 seedlings, the expression of primary CesAs (NtCesA1, NtCesA3, and NtCesA6) was enhanced, as well as of proteins involved in the biosynthesis of non-cellulosic polysaccharides (xyloglucans and galacturonans, NtXyl4, NtGal10), cell wall remodeling (NtExp11 and XTHs), and cell expansion (NtPIP1.1 and NtPIP2.7). While in leaves the expression level of all secondary cell wall CesAs (NtCesA4, NtCesA7, and NtCesA8) did not change significantly, both primary and secondary CesAs were differentially expressed in the stem. The amount of cellulose and matrix polysaccharides significantly increased in the F31 seedlings with no differences in pectin and hemicellulose glycosyl composition. Our results highlight the potentiality to overexpress primary CesAs in tobacco plants to enhance cellulose synthesis and biomass production.

Keywords: AtCesA6; Nicotiana tabacum; cell wall; cellulose; cellulose synthase complex; matrix polysaccharides; plant growth; primary and secondary CesAs.


Conflict of interest statement

The authors declare no conflict of interest.

Figures

Figure 1
Figure 1
Amount of GFP-CesA6 in five transformed tobacco lines (F31, F32, F33, F34, and F35). (a) RT-qPCR analyses of AtCesA6; amplification output values are expressed as 2-∆Cq ± SD for AtCesA6 mRNA in wt and transformed lines and are considered as proportional to the amount of mRNA target according to Schmittgen and Livak [49]. (b) Western blot analyses of membrane protein fractions in leaves of 2-month-old wt and transformed tobacco seedlings stably expressing GFP-CesA6; bands were detected by anti-GFP. The results of three independent biological and three technical replicates are presented with box plots.
Figure 2
Figure 2
Wt and F31 tobacco seeds. (a,b) Stereomicroscope images and average values of morphometric parameters of wt and F31 tobacco seeds; the data are the mean ± SD of 100 measurements on wt and F31 seeds. (c,d) Confocal microscope images of wt and F31 seeds evidence the cell wall autofluorescence of jigsaw-puzzle-shaped pavement cells. Bar scale = 500 µm.
Figure 3
Figure 3
Tobacco wt and F31 plant phenotypes at different stages of growth. (a) 1-month-old tobacco seedlings; (b) 2-month-old tobacco seedlings; (c) 5-month-old tobacco plants; (d) tobacco plant phenotype at the flowering stage; (e) enlarged detail of (d); (f) flowers; (g,h) enlarged detail of (f). Bar scale: 2 cm (a,b), 10 cm (c), 7 cm (d,f), 2 cm (e,g,h).
Figure 4
Figure 4
Morphometric parameters of 2-month-old wt and F31 seedlings. The data are the mean ± SD of 50 samples examined for each line. Asterisk indicates significant differences (p < 0.05; *), according to the t-Student test, between the two samples. fw: fresh weight. Bar scale = 2 cm.
Figure 5
Figure 5
Morphometric parameters of wt and F31 leaves and cotyledons of 2-month-old seedlings. An amount of 30 leaves for each sample were examined for each line. The data represent the mean ± SD. Asterisk indicates significant differences (p < 0.05; *), according to the t-Student test, between the two samples.
Figure 6
Figure 6
Representative transmitted light confocal images of wt and F31 leaf epidermal pavement cells of abaxial lamina and quantitative evaluation of the cell area in wt and F31 line. The data are reported with box plot graph. Asterisks indicate highly significant differences (p < 0.001; **), according to the t-Student test, between the two samples.
Figure 7
Figure 7
RT-qPCR analyses of NtCesA1, NtCesA3, NtCesA6, NtCesA4, NtCesA7, NtCesA8, NtXyl4, NtGal10, NtExp11, NtPIP1.1, and NtPIP2.7 genes in leaves of 2-month-old wt and F31 tobacco seedlings. The gene expression is reported as transcript inhibition level in F31 leaves (log2 of fold change) with respect to wt. The results of three independent biological and three technical replicates are presented with box plots. The horizontal red dashed lines indicate the significant threshold of log2foldchange.
Figure 8
Figure 8
Western blot of soluble (SOL), membrane (MEM), and cell wall (CW) proteins of wt and F31 tobacco leaves of 2-month-old seedlings. (a) XTH abundance in the cell wall fraction protein of wt and F31 lines; (b) quantification of XTH abundance, reported as average of pixel numbers represented with box plots. Immunolocalization was carried out with an anti-XTH serum. Asterisks indicate highly significant differences (p < 0.001; **), according to the t-Student test, between the two samples.
Figure 9
Figure 9
Confocal microscope images of transverse sections of the stem first internode of 2-month-old wt and F31 tobacco seedlings. (a,b) Transmitted light confocal images; (c,d) transverse sections stained with fuchsin A (red) and calcofluor white (blue). Bar scale = 500 µm. (e) Quantification of secondary xylem in the stem of wt and F31 tobacco seedlings. The measurements are reported with box thickness plot graph. Asterisks indicate highly significant differences (p < 0.001; **), according to the t-Student test, between the two samples. (f) RT-qPCR analyses of NtCesA1, NtCesA3, NtCesA6, NtCesA4, NtCesA7, and NtCesA8 genes in the stem of 2-month-old wt and F31 tobacco seedlings. The gene expression is reported as transcript inhibition level in F31 leaves (log2foldchange) with respect to wt. The results of three independent biological and three technical replicates are presented with box plots. The horizontal red dashed lines indicate the significant threshold of log2foldchange.
Figure 10
Figure 10
Log2foldchange in the composition of some selected components of the hydrolyzates from CDTA + Na2CO3 (pectins, (a)) and KOH 0.5–4.0 M (hemicelluloses, (b)) extracts obtained from the purified cell walls from the leaves of wt and F31 tobacco 2-month-old seedlings. Data of four independent experiments are presented. GalA, galacturonic acid; OGAs, Oligogalacturonides; Rha, rhamnose MeO, Methoxy groups; Ac, Acetyl groups; FCA, ferulic acid; Man, mannose; Glc, glucose; Xyl, xylose; Fuc, fucose. The horizontal red dashed lines indicate the significant threshold of log2foldchange.
Figure 11
Figure 11
Biosynthesis of cell wall polysaccharides in wt and F31 tobacco leaf protoplasts. Protoplasts were incubated in the presence of 430 kBq of D-(U-14C)glucose for 8 h. Radioactive matrix cell-wall polysaccharides and α-cellulose were isolated from wt and F31 tobacco leaf protoplasts. Radioactivity is reported as percentage of the homogenate (approx. 23 kBq for both wt and F31 lines). Data are represented as box plots of three independent experiments. Asterisk indicates significant differences (p < 0.05; *), according to the t-Student test, between the two samples.

Similar articles

Cited by

References

    1. Cosgrove D.J., Jarvis M.C. Comparative structure and biomechanics of plant primary and secondary cell walls. Front. Plant Sci. 2012;22:204. doi: 10.3389/fpls.2012.00204. - DOI - PMC - PubMed
    1. Brown R.M., Jr. Cellulose structure and biosynthesis: What is in store for the 21st century? J. Polym. Sci. Part A Polym. Chem. 2004;42:487–495. doi: 10.1002/pola.10877. - DOI
    1. Desprez T., Juraniec M., Crowell E.F., Jouy H., Pochylova Z., Parcy F., Höfte H., Gonneau M., Vernetthes S. Organization of cellulose synthase complexes involved in primary cell wall synthesis in Arabidopsis thaliana. Proc. Natl. Acad. Sci. USA. 2007;104:15572–15577. doi: 10.1073/pnas.0706569104. - DOI - PMC - PubMed
    1. Polko J.K., Kieber J.J. The regulation of cellulose biosynthesis in plants. Plant Cell. 2019;31:282–296. doi: 10.1105/tpc.18.00760. - DOI - PMC - PubMed
    1. Rodriguez-Restrepo Y.A., Rocha C.M.R., Teixeira J.A., Orrego C.E. Valorization of Passion Fruit Stalk by the Preparation of Cellulose Nanofibers and Immobilization of Trypsin. Fibers. Polym. 2020;21:2807–2816. doi: 10.1007/s12221-020-1342-2. - DOI

LinkOut - more resources