Analysis of a Library of Escherichia coli Transporter Knockout Strains to Identify Transport Pathways of Antibiotics
- PMID: 36009997
- PMCID: PMC9405208
- DOI: 10.3390/antibiotics11081129
Analysis of a Library of Escherichia coli Transporter Knockout Strains to Identify Transport Pathways of Antibiotics
Abstract
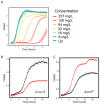
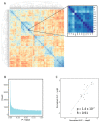
Antibiotic resistance is a major global healthcare issue. Antibiotic compounds cross the bacterial cell membrane via membrane transporters, and a major mechanism of antibiotic resistance is through modification of the membrane transporters to increase the efflux or reduce the influx of antibiotics. Targeting these transporters is a potential avenue to combat antibiotic resistance. In this study, we used an automated screening pipeline to evaluate the growth of a library of 447 Escherichia coli transporter knockout strains exposed to sub-inhibitory concentrations of 18 diverse antimicrobials. We found numerous knockout strains that showed more resistant or sensitive phenotypes to specific antimicrobials, suggestive of transport pathways. We highlight several specific drug-transporter interactions that we identified and provide the full dataset, which will be a useful resource in further research on antimicrobial transport pathways. Overall, we determined that transporters are involved in modulating the efficacy of almost all the antimicrobial compounds tested and can, thus, play a major role in the development of antimicrobial resistance.
Keywords: Escherichia coli; antibiotics; transporters.
Conflict of interest statement
The authors declare no conflict of interest. The funders had no role in the design of the study; in the collection, analyses, or interpretation of data; in the writing of the manuscript; or in the decision to publish the results.
Figures


Similar articles
-
Antidepressant fluoxetine induces multiple antibiotics resistance in Escherichia coli via ROS-mediated mutagenesis.Environ Int. 2018 Nov;120:421-430. doi: 10.1016/j.envint.2018.07.046. Epub 2018 Aug 18. Environ Int. 2018. PMID: 30125859
-
Transporters HP0939, HP0497, and HP0471 participate in intrinsic multidrug resistance and biofilm formation in Helicobacter pylori by enhancing drug efflux.Helicobacter. 2020 Aug;25(4):e12715. doi: 10.1111/hel.12715. Epub 2020 Jun 16. Helicobacter. 2020. PMID: 32548895
-
Efflux drug transporters at the forefront of antimicrobial resistance.Eur Biophys J. 2017 Oct;46(7):647-653. doi: 10.1007/s00249-017-1238-2. Epub 2017 Jul 14. Eur Biophys J. 2017. PMID: 28710521 Free PMC article. Review.
-
Gene Amplification Uncovers Large Previously Unrecognized Cryptic Antibiotic Resistance Potential in E. coli.Microbiol Spectr. 2021 Dec 22;9(3):e0028921. doi: 10.1128/Spectrum.00289-21. Epub 2021 Nov 10. Microbiol Spectr. 2021. PMID: 34756069 Free PMC article.
-
Bacterial multidrug efflux transporters.Annu Rev Biophys. 2014;43:93-117. doi: 10.1146/annurev-biophys-051013-022855. Annu Rev Biophys. 2014. PMID: 24702006 Free PMC article. Review.
Cited by
-
The Biology and Biochemistry of Kynurenic Acid, a Potential Nutraceutical with Multiple Biological Effects.Int J Mol Sci. 2024 Aug 21;25(16):9082. doi: 10.3390/ijms25169082. Int J Mol Sci. 2024. PMID: 39201768 Free PMC article. Review.
-
PhoPQ-mediated lipopolysaccharide modification governs intrinsic resistance to tetracycline and glycylcycline antibiotics in Escherichia coli.mSystems. 2024 Oct 22;9(10):e0096424. doi: 10.1128/msystems.00964-24. Epub 2024 Sep 30. mSystems. 2024. PMID: 39345149 Free PMC article.
-
Identification of transporters involved in aromatic compounds tolerance through screening of transporter deletion libraries.Microb Biotechnol. 2024 Apr;17(4):e14460. doi: 10.1111/1751-7915.14460. Microb Biotechnol. 2024. PMID: 38635191 Free PMC article.
-
Carrier-mediated transport as a common route of antibiotic ingress into bacteria.mBio. 2025 Aug 13;16(8):e0161625. doi: 10.1128/mbio.01616-25. Epub 2025 Jul 9. mBio. 2025. PMID: 40631918 Free PMC article.
References
-
- WHO Ten Threats to Global Health in 2019. [(accessed on 8 July 2022)]. Available online: https://www.who.int/news-room/spotlight/ten-threats-to-global-health-in-....
Grants and funding
LinkOut - more resources
Full Text Sources
Molecular Biology Databases

