. 2022 Aug 9;11(16):2472.
doi: 10.3390/cells11162472.

Artesunate Inhibits the Cell Growth in Colorectal Cancer by Promoting ROS-Dependent Cell Senescence and Autophagy

Affiliations

Artesunate Inhibits the Cell Growth in Colorectal Cancer by Promoting ROS-Dependent Cell Senescence and Autophagy

Zhiying Huang et al. Cells. .

Abstract

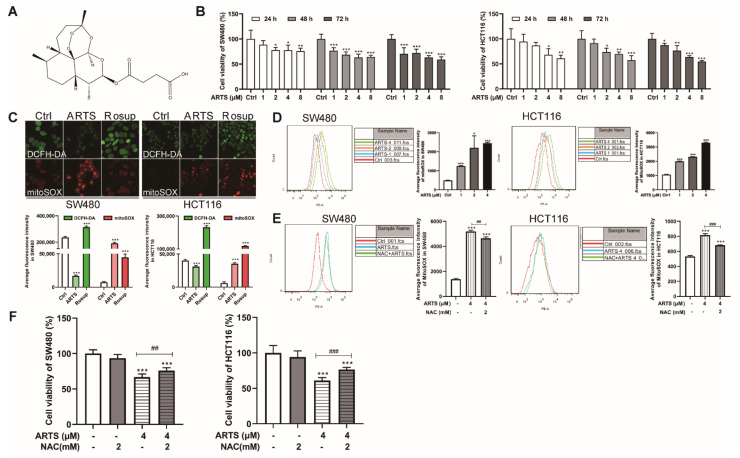
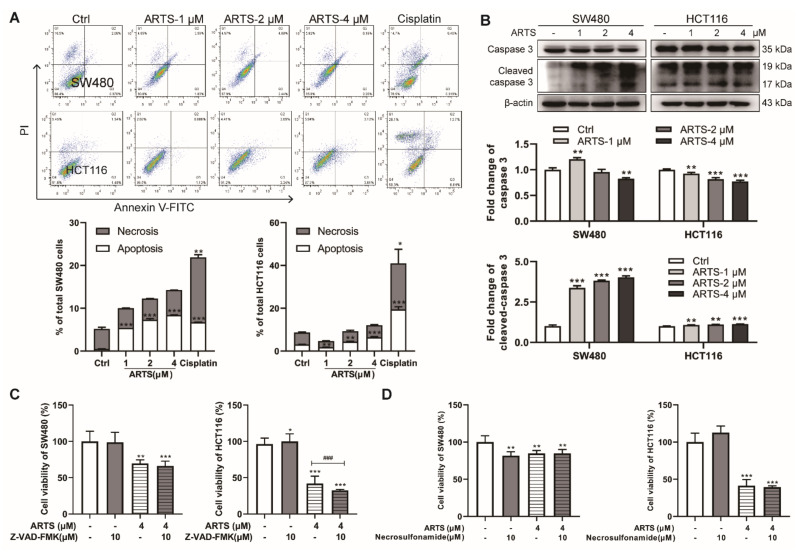
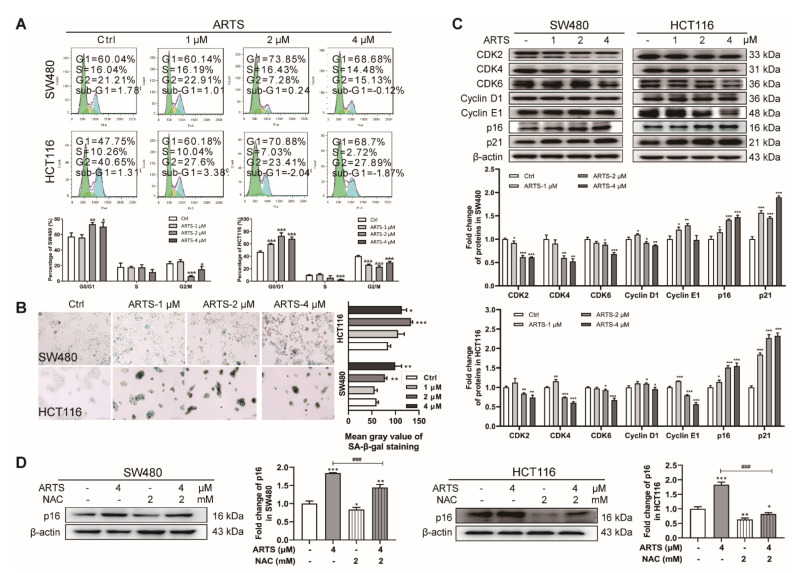
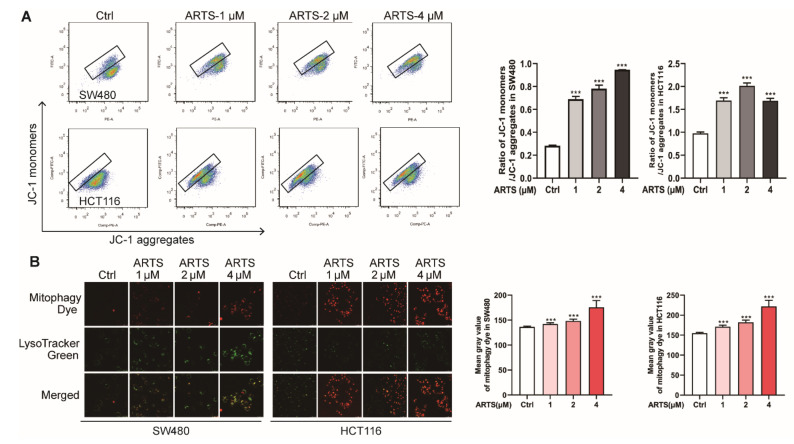
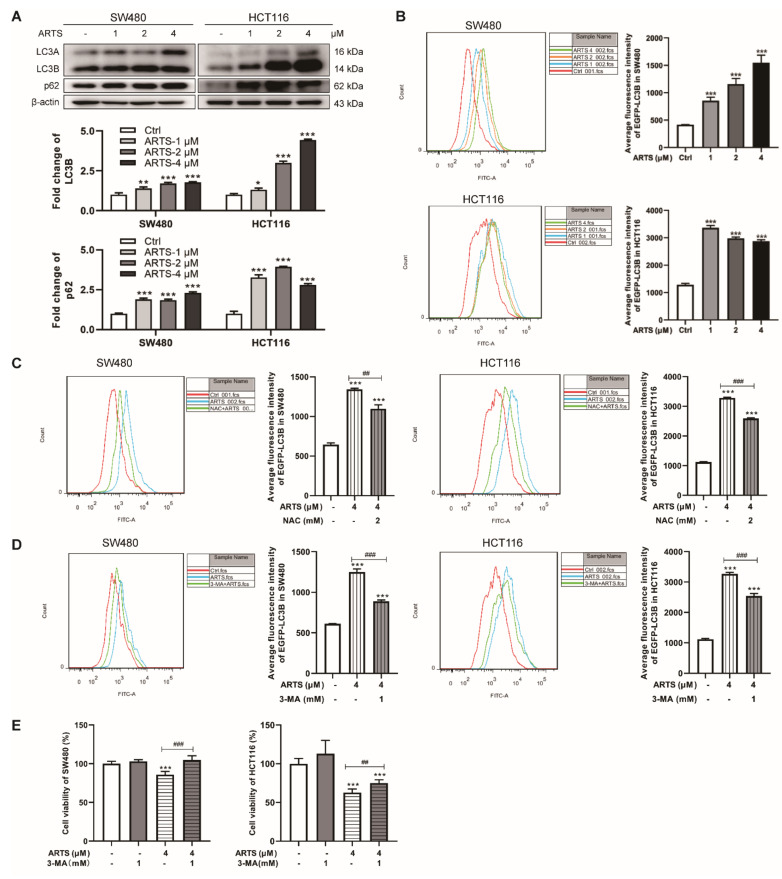
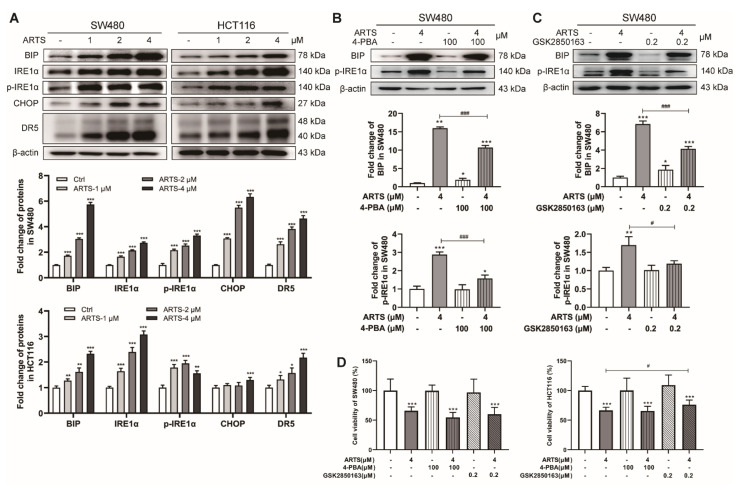
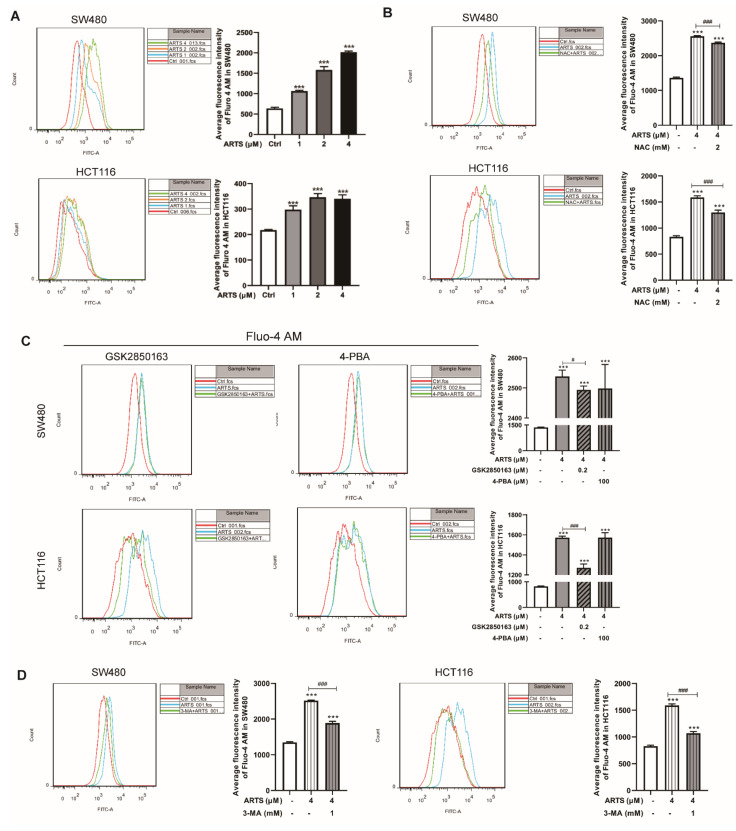
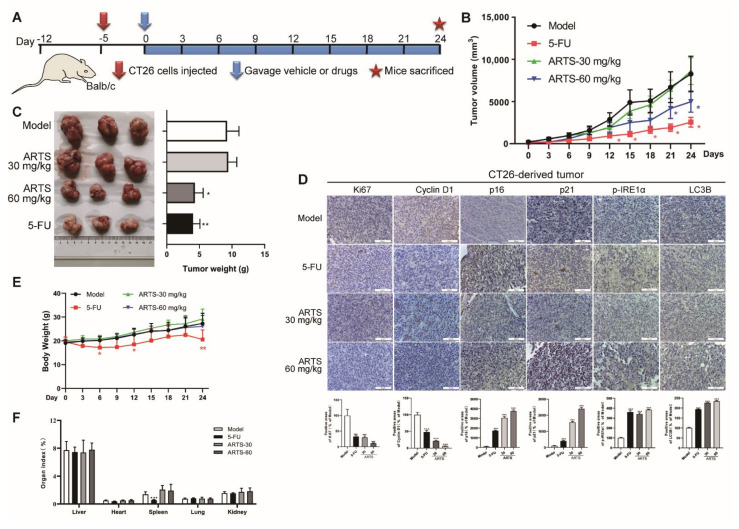
Although artesunate has been reported to be a promising candidate for colorectal cancer (CRC) treatment, the underlying mechanisms and molecular targets of artesunate are yet to be explored. Here, we report that artesunate acts as a senescence and autophagy inducer to exert its inhibitory effect on CRC in a reactive oxygen species (ROS)-dependent manner. In SW480 and HCT116 cells, artesunate treatment led to mitochondrial dysfunction, drastically promoted mitochondrial ROS generation, and consequently inhibited cell proliferation by causing cell cycle arrest at G0/G1 phase as well as subsequent p16- and p21-mediated cell senescence. Senescent cells underwent endoplasmic reticulum stress (ERS), and the unfolded protein response (UPR) was activated via IRE1α signaling, with upregulated BIP, IRE1α, phosphorylated IRE1α (p-IRE1α), CHOP, and DR5. Further experiments revealed that autophagy was induced by artesunate treatment due to oxidative stress and ER stress. In contrast, N-Acetylcysteine (NAC, an ROS scavenger) and 3-Methyladenine (3-MA, an autophagy inhibitor) restored cell viability and attenuated autophagy in artesunate-treated cells. Furthermore, cellular free Ca2+ levels were increased and could be repressed by NAC, 3-MA, and GSK2350168 (an IRE1α inhibitor). In vivo, artesunate administration reduced the growth of CT26 cell-derived tumors in BALB/c mice. Ki67 and cyclin D1 expression was downregulated in tumor tissue, while p16, p21, p-IRE1α, and LC3B expression was upregulated. Taken together, artesunate induces senescence and autophagy to inhibit cell proliferation in colorectal cancer by promoting excessive ROS generation.

Keywords: artesunate; autophagy; cell senescence; colorectal cancer; reactive oxygen species.


Conflict of interest statement

The authors declare no conflict of interest.

Figures

Figure 1
Figure 1
Artesunate inhibited cell viabilities partially due to excessive mitochondrial ROS. (A) The endoperoxide structure of artesunate. (B) Artesunate inhibited cell viabilities of SW480 and HCT116 dose-dependently. The colorectal cancer cell lines, SW480 and HCT116, were seeded in 96-well plates and treated with artesunate at 1, 2, 4, and 8 μM for 24, 48, 72 h. Cell viabilities were detected via CCK8 assay. (C) Artesunate caused mitochondrial ROS generation. Cells were seeded in glass-bottomed dishes and treated with artesunate (4 μM) for 72 h. DCFH-DA (Green) and MitoSOXTM Red (Red) was used to label the total intracellular ROS and mitochondrial specific ROS respectively. Images were captured by confocal microscope (Scale bar = 25 μm). Rosup was used as a positive agent of ROS inducer. (D) Mitochondrial ROS was increased dose-dependently. Cells were probed with MitoSOXTM Red after artesunate treatment. The fluorescence intensity of MitoSOXTM Red was record by flow cytometry to indicate the mitochondrial ROS level. The ROS scavenger NAC helped to (E) decrease the mitochondrial ROS, and (F) restore cell viabilities in treated SW480 and HCT116. NAC was used at a concentration of 2 mM and added alone or together with artesunate (4 μM) for 72 h before cell viability assay and MitoSOXTM Red incubation. * p < 0.05, ** p < 0.01, and *** p < 0.001 vs. Ctrl. ## p < 0.01, and ### p < 0.001 vs. cells treated with artesunate alone. Data were shown as mean ± SD.
Figure 2
Figure 2
Artesunate-induced mild apoptosis could not help to inhibit cell viabilities of SW480 and HCT116. (A) Artesunate only induced mild apoptosis in SW480 and HCT116. Cells were seeded in 6-well plates and treated with artesunate (1, 2, and 4 μM) for 72 h. Afterwards, all cells (suspended and attached) were harvested. After incubation with anti-Annexin V-FITC primary antibody and PI solution, apoptotic cells were detected via flow cytometry. Cisplatin was used as positive drug for cell apoptosis at a concentration of 30 μM for 24 h. (B) Artesunate upregulated the protein level of cleaved-caspase 3 in SW480 and HCT116. Cells were seeded in 60 mm dishes and treated with artesunate (1, 2, and 4 μM) for 72 h. Then, cells were lysed with RIPA to extract total protein. The protein levels were measured by western blotting. The gray values of protein blots were evaluated by Image J. Relative protein expression was normalized to β-actin. (C) Z-VAD-FMK, a pan-caspase inhibitor, and (D) necrosulfonamide, a necrosis inhibitor, could not help to restore cell viabilities. Z-VAD-FMK and necrosulfonamide were used at a concentration of 10 μM and added alone or together with artesunate (4 μM) for 72 h. Cell viabilities were detected via CCK8 assay. * p < 0.05, ** p < 0.01, and *** p < 0.001 vs. Ctrl. ### p < 0.001 vs. cells treated with artesunate alone. Data were shown as mean ± SD.
Figure 3
Figure 3
Artesunate caused excessive mitochondrial ROS to induce cell senescence and inhibit cell proliferation. (A) Artesunate arrested cell cycle at G0/G1 phase in SW480 and HCT116. Cells were seeded in 6-well plates. Once attached, cells were maintained in FBS-free medium for about 16~24 h. Afterwards, cell were treated with artesunate (1, 2, and 4 μM in medium containing 10% FBS) for 72 h and then harvested for PI staining to analyze cell cycle by flow cytometry. (B) Artesunate induced cell senescence in SW480 and HCT116. Cells were seeded in 6-well plates and treated with artesunate (1, 2, and 4 μM) for 72 h. Cell senescence was represented via SA-β-gal activity, which was assayed using a SA-β-gal staining kit after artesunate treatment. (C) Artesunate treatment downregulated the protein levels of CDK 2/4/6 and upregulated the protein levels of CDKIs, p16, and p21 in SW480 and HCT116. Cells were seeded in 60 mm dishes and treated with artesunate (1, 2, and 4 μM) for 72 h. Then, cells were lysed with RIPA to extract total protein. The protein levels were measured by western blotting. The gray values of protein blots were evaluated by Image J. Relative protein expression was normalized to β-actin. (D) NAC attenuated the effect of artesunate on protein expression of p16 in SW480 and HCT116. NAC was used at a concentration of 2 mM and added alone or together with artesunate (4 μM) for 72 h. * p < 0.05, ** p < 0.01, and *** p < 0.001 vs. Ctrl. ### p < 0.001 vs. cells treated with artesunate alone. Data were shown as mean ± SD.
Figure 4
Figure 4
Artesunate promoted mitochondria depolarization and resulted in mitophagy. (A) Artesunate caused mitochondria depolarization. Cells were seeded in 6-well plates and treated with artesunate (1, 2, 4 μM) for 24 h and then incubated with JC-1. The average intensity of green fluorescence from cytoplasmic JC-1 monomers and the red fluorescence from JC-1 aggregates was recorded by flow cytometry. The ratio between JC-1 monomers and JC-1 aggregates represented mitochondria depolarization and the damaged mitochondrial membrane permeability. (B) Artesunate induced mitophagy in SW480 and HCT116 dose-dependently. Cells were seeded in glass-bottomed dishes. Cells were loaded with mitophagy dye before artesunate treatment. After being treated with artesunate (1, 2, and 4 μM) for 72 h, images were captured immediately by confocal microscope (Scale bar = 25 μm). The intensity of red fluorescence was calculated by Image J. *** p < 0.001 vs. Ctrl. Data were shown as mean ± SD.
Figure 5
Figure 5
Artesunate caused autophagy to inhibit cell proliferation ROS-dependently. (A) Artesunate upregulated the expression levels of LC3B and p62. Cells were seeded in 60 mm dishes and treated with artesuante (1, 2, 4 μM) for 72 h. Then, cells were lysed with RIPA to extract total protein. The protein levels were measured by western blotting. The gray values of protein blots were evaluated by Image J. Relative protein expression was normalized to β-actin. (B) Artesunate induced the expression of exogenous LC3B. SW480 and HCT116 were transfected with pEGFP-LC3B-C1 plasmid and then treated with artesunate (1, 2, and 4 μM) for 72 h. The fluorescence intensity of EGFP, which was analyzed by flow cytometry, represented the expression level of exogenous LC3B. (C) NAC helped to reduce the fluorescence intensity of EGFP. 3-MA was used at a concentration of 1 μM and added alone or together with artesunate (4 μM) for 72 h. 3-MA, an autophagy inhibitor, helped to (D) reduced the fluorescence intensity of EGFP and (E) restore cell viabilities of SW480 and HCT116. * p < 0.05, ** p < 0.01, and *** p < 0.001 vs. Ctrl. ## p < 0.01, and ### p < 0.001 vs. cells treated with artesunate alone. Data were shown as mean ± SD.
Figure 6
Figure 6
Artesunate induced ER stress and activated UPR via IRE1α signaling. (A) Artesunate induced the expression of ER stress sensor BIP and activated the IRE1α branch of UPR pathways. The protein levels of BIP, IRE1α, phosphorylated-IRE1α (p-IRE1α), CHOP, and DR5 were detected by western blotting. (B) The ER stress inhibitor 4-PBA and (C) IRE1α inhibitor GSK2350168 helped to reduce the protein levels of BIP and p-IRE1α. (D) GSK2350168 helped to restore cell viabilities in HCT116. 4-PBA was used at a concentration of 100 μM and added alone or together with artesunate (4 μM) for 72 h. GSK2350168 was used at a concentration of 0.2 μM and added alone or together with artesunate (4 μM) for 72 h. * p < 0.05, ** p < 0.01, and *** p < 0.001 vs. Ctrl. # p < 0.05, ### p < 0.001 vs. cells treated with artesunate alone. Data were shown as mean ± SD.
Figure 7
Figure 7
(A) Artesunate increased the cellular free Ca2+ level markedly. After artesunate treatment, cells were probed with Fluo 4-AM and analyzed by flow cytometry. The green fluorescence intensity of Fluo 4-AM represented cellular free Ca2+ level. (B) ROS scavenger NAC, (C) IRE1α inhibitor GSK2850163, and (D) autophagy inhibitor 3-MA helped to reduce cellular free Ca2+ level. *** p < 0.001 vs. Ctrl. # p < 0.05, ### p < 0.001 vs. cells treated with artesunate alone. Data were shown as mean ± SD.
Figure 8
Figure 8
Artesunate inhibited the growth of CT26-derived tumor in vivo. (A) Experimental timeline of CT26-derived tumor model in balb/c mice. Balb/c mice were injected CT-26 cells (1 × 10⁵ cells for each mouse) subcutaneously to establish the CT26-derived tumor model. Tumor-loaded mice were gavaged with artesunate at 30 mg/kg or 60 mg/kg for 24 days. Body weights and tumor volumes were recorded every three days. (B) Curve of tumor volume. (C) Tumor weight. Tumor tissues were collected and weighted after treatment. (D) Immunohistochemical images of Ki67, Cyclin D1, p16, p21, LC3B, and p-IRE1α. Immunohistochemistry assay was performed using a SABC-POD staining kit. (E) Curve of body weight. (F) Organ indexes. Lung, heart, spleen, liver, and kidney were collected and weighted to calculate the organ indexes after treatment. * p < 0.05, *** p < 0.001 vs. Model group. Data were shown as mean ± SD.

References

    1. Sung H., Ferlay J., Siegel R.L., Laversanne M., Soerjomataram I., Jemal A., Bray F. Global Cancer Statistics 2020: GLO-BOCAN Estimates of Incidence and Mortality Worldwide for 36 Cancers in 185 Countries. CA Cancer J. Clin. 2021;71:209–249. doi: 10.3322/caac.21660. - DOI - PubMed
    1. Xi Y., Xu P. Global colorectal cancer burden in 2020 and projections to 2040. Transl. Oncol. 2021;14:101174. doi: 10.1016/j.tranon.2021.101174. - DOI - PMC - PubMed
    1. Benson A.B., Venook A.P., Al-Hawary M.M., Arain M.A., Chen Y.-J., Ciombor K.K., Cohen S., Cooper H.S., Deming D., Farkas L., et al. Colon Cancer, Version 2.2021, NCCN Clinical Practice Guidelines in Oncology. J. Natl. Compr. Cancer Netw. 2021;19:329–359. doi: 10.6004/jnccn.2021.0012. - DOI - PubMed
    1. Li J., Casteels T., Frogne T., Ingvorsen C., Honoré C., Courtney M., Huber K.V.M., Schmitner N., Kimmel R.A., Romanov R.A., et al. Artemisinins Target GABA(A) Receptor Signaling and Impair α Cell Identity. Cell. 2017;168:86–100. doi: 10.1016/j.cell.2016.11.010. - DOI - PMC - PubMed
    1. Fan M., Li Y., Yao C., Liu X., Liu J., Yu B. DC32, a Dihydroartemisinin Derivative, Ameliorates Collagen-Induced Arthritis Through an Nrf2-p62-Keap1 Feedback Loop. Front. Immunol. 2018;9:2762. doi: 10.3389/fimmu.2018.02762. - DOI - PMC - PubMed

Publication types