. 2022 Aug 11;11(16):2491.
doi: 10.3390/cells11162491.

Effects of Extracellular Vesicles from Osteogenic Differentiated Human BMSCs on Osteogenic and Adipogenic Differentiation Capacity of Naïve Human BMSCs

Affiliations

Effects of Extracellular Vesicles from Osteogenic Differentiated Human BMSCs on Osteogenic and Adipogenic Differentiation Capacity of Naïve Human BMSCs

Chenglong Wang et al. Cells. .

Abstract

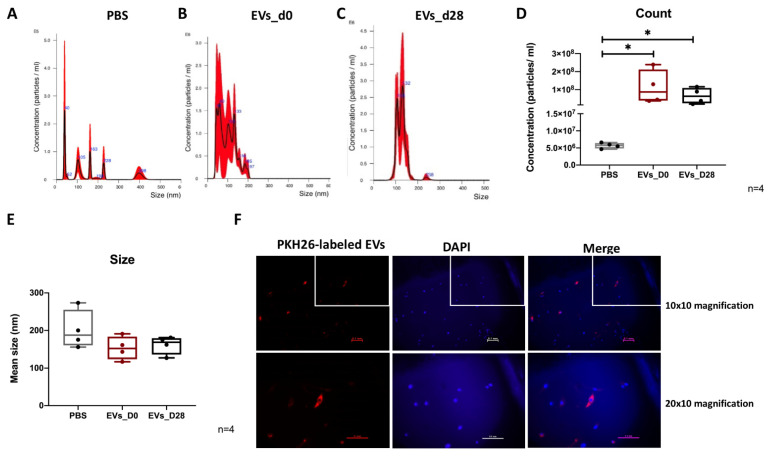
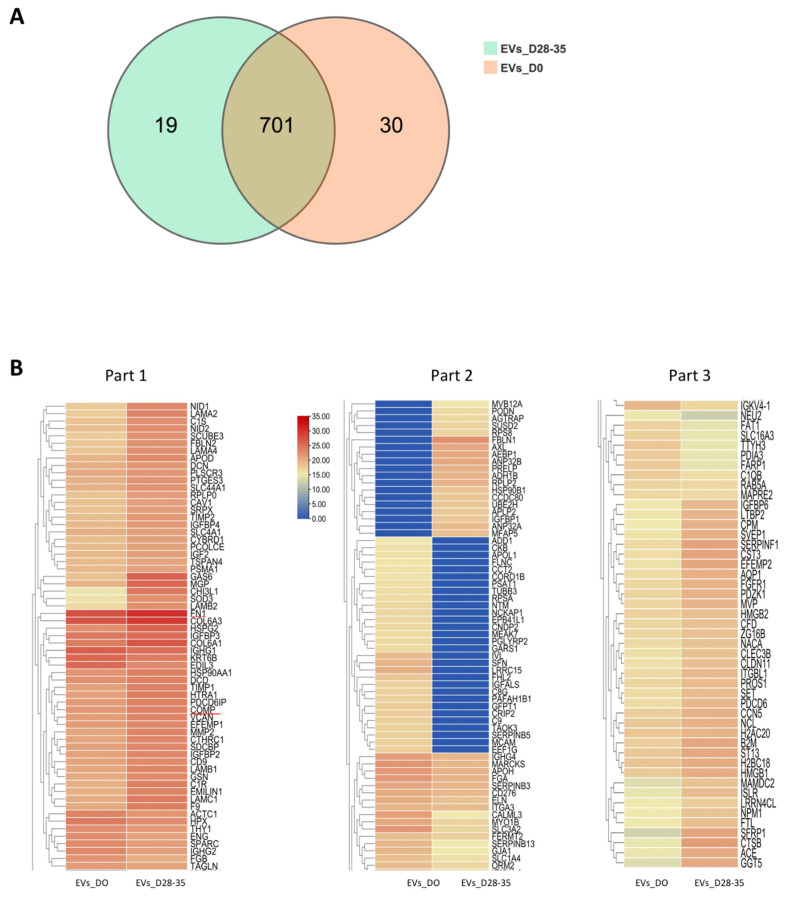
Osteoporosis, or steroid-induced osteonecrosis of the hip, is accompanied by increased bone marrow adipogenesis. Such a disorder of adipogenic/osteogenic differentiation, affecting bone-marrow-derived mesenchymal stem cells (BMSCs), contributes to bone loss during aging. Here, we investigated the effects of extracellular vesicles (EVs) isolated from human (h)BMSCs during different stages of osteogenic differentiation on the osteogenic and adipogenic differentiation capacity of naïve (undifferentiated) hBMSCs. We observed that all EV groups increased viability and proliferation capacity and suppressed the apoptosis of naïve hBMSCs. In particular, EVs derived from hBMSCs at late-stage osteogenic differentiation promoted the osteogenic potential of naïve hBMSCs more effectively than EVs derived from naïve hBMSCs (naïve EVs), as indicated by the increased gene expression of COL1A1 and OPN. In contrast, the adipogenic differentiation capacity of naïve hBMSCs was inhibited by treatment with EVs from osteogenic differentiated hBMSCs. Proteomic analysis revealed that osteogenic EVs and naïve EVs contained distinct protein profiles, with pro-osteogenic and anti-adipogenic proteins encapsulated in osteogenic EVs. We speculate that osteogenic EVs could serve as an intercellular communication system between bone- and bone-marrow adipose tissue, for transporting osteogenic factors and thus favoring pro-osteogenic processes. Our data may support the theory of an endocrine circuit with the skeleton functioning as a ductless gland.

Keywords: ECM remodeling; adipogenic differentiation; bone regeneration; extracellular vesicles; mesenchymal stem cells; osteogenic differentiation; osteogenic potential.


Conflict of interest statement

The authors declare no conflict of interest.

Figures

Figure 1
Figure 1
Overview of experimental set-up; EVs = extracellular vesicles.
Figure 2
Figure 2
Molecular characterization of EVs. (AC) Particle size distribution of PBS, naïve hBMSCs-EVs and osteogenic EVs was measured by NTA analysis. n = 4. (D,E) Quantitative comparison among PBS, naïve hBMSCs-EVs and osteogenic EVs in count and size measured by NTA analysis. n = 4. * p < 0.05; two-tailed Mann–Whitney U-test was used to compare differences between different groups. (F) Uptake of EVs by hBMSCs. PKH26-labeled EVs_D28 (red) were internalized by hBMSCs and visualized with fluorescence microscopy. Cell nuclei were stained with DAPI. Scale bar: 100 μm. n = 2.
Figure 3
Figure 3
Effects of EVs derived from different stages of BMSC osteogenesis on naïve hBMSC proliferation, viability and apoptosis. (A) For proliferation analysis, naïve hBMSCs were stimulated for 3 days with the different EV groups or PBS (no EVs) in medium containing 1% EV-depleted FCS; n = 6–7. Analysis of viability (B) and apoptosis (C) of naïve hBMSCs after stimulation for 3 days with the different EV groups or PBS (no EVs) in medium containing 1% EVs-depleted FCS; n = 6–7. Results were calculated as percentage to the control group (no EVs, shown by the dotted line); * p < 0.05; Wilcoxon signed-rank test was used when no EVs group was set to 100%, and two-tailed Mann–Whitney U-test was used to compare differences between different EV-treated groups.
Figure 4
Figure 4
Evaluation of osteogenic differentiation of naïve hBMSCs after EV treatment. (A) Alizarin Red staining of hBMSCs after 21 days of osteogenic differentiation and treatment with the different EVs groups. Microscopic view (scale bar: 0.5 mm) and macroscopic view (scale bar: 1 cm); n = 6–8. (B) Quantification of Alizarin Red staining; n = 6–8. (C) Alkaline Phosphatase (ALP) activity of hBMSC after 14 days of osteogenic differentiation and treatment with the different EV groups; n = 7. Results were calculated as percentage to the control group (no EVs, shown by the dotted line); * p < 0.05, ** p < 0.01; Wilcoxon signed-rank test was used when no EVs group was set to 100%, and two-tailed Mann–Whitney U-test was used to compare differences between different EV-treated groups.
Figure 5
Figure 5
Evaluation of osteogenic marker gene expression in hBMSCs after EV treatment. (AE) Gene expression level of the osteogenic marker genes (OPN, BGLAP, ALP, RUNX2, and COL1A1) were analyzed after 14 days of osteogenic differentiation of hBMSCs and simultaneous stimulation with the different EV groups. Results were calculated as percentage to the control group (no EVs, shown by the dotted line); * p < 0,05; Wilcoxon signed-rank test was used when no EVs group was set to 100%, and two-tailed Mann–Whitney U-test was used to compare differences between different EV-treated groups; n = 5–7.
Figure 6
Figure 6
Evaluation of adipogenic differentiation of naïve hBMSCs after EV treatment. (A) Microscopic view of Oil red O staining of hBMSCs after 21 days of adipogenic differentiation of hBMSCs and treatment with the different EVs groups; n = 8. (B) Quantification of Oil red O staining; n = 8. (CE) Gene expression level of adipogenic markers such as ADIPOQ, C/EBPα, and PPARγ after 14 days of adipogenic differentiation and simultaneous stimulation with the different EVs groups; n = 6–8. Results were calculated as percentage to the control group (no EVs, shown by the dotted line); * p < 0.05, ** p < 0.01; Wilcoxon signed-rank test was used when no EVs group was set to 100%, and two-tailed Mann–Whitney U-test was used to compare differences between different EV-treated groups. Scale bar: 100 μm.
Figure 7
Figure 7
Venn diagram of total proteins and heatmap of significantly different proteins. (A) Venn diagram showing the distinct profiles of total proteins in the EVs_D28-35 and EVs_D0; n = 3. (B) Heatmap showing the distinct significant protein profiles of the EVs_D28-35 compared to EVs_D0; n = 3.
Figure 8
Figure 8
Functional enrichment analysis of significantly regulated proteins. Gene ontology (GO) analysis for the top 20 terms of upregulated cellular components (A), molecular functions (B), and biological processes (C). Kyoto Encyclopedia of Genes and Genomes enrichment analysis for significant proteins were clustered, and the top 20 pathways are shown; n = 3. Note: −log10 (p = 0.05) = 1.30 (the bottom horizontal axis number). −log10 (p = 0.01) = 2. −log10 (p = 0.001) = 3.
Figure 9
Figure 9
Summary Osteogenic primed EVs positively regulate osteogenic differentiation and negatively regulate adipogenic differentiation capacity of naïve hBMSCs.

References

    1. Caplan A.I. Mesenchymal Stem-Cells. J. Orthop. Res. 1991;9:641–650. doi: 10.1002/jor.1100090504. - DOI - PubMed
    1. Pittenger M.F., Mackay A.M., Beck S.C., Jaiswal R.K., Douglas R., Mosca J.D., Moorman M.A., Simonetti D.W., Craig S., Marshak D.R. Multilineage potential of adult human mesenchymal stem cells. Science. 1999;284:143–147. doi: 10.1126/science.284.5411.143. - DOI - PubMed
    1. Paula F.J.A., Rosen C.J. Marrow Adipocytes: Origin, Structure, and Function. In: Nelson M.T., Walsh K., editors. Annual Review of Physiology. Volume 82. 2020. pp. 461–484. Annual Review of Physiology. - PubMed
    1. Gómez-Ambrosi J., Rodríguez A., Catalán V., Frühbeck G. The Bone-Adipose Axis in Obesity and Weight Loss. Obes. Surg. 2008;18:1134–1143. doi: 10.1007/s11695-008-9548-1. - DOI - PubMed
    1. Wang Q.Y., Yang Q.W., Chen G.Y., Du Z.W., Ren M., Wang A., Zhao H.Y., Li Z.Y., Zhang G.Z., Song Y. LncRNA expression profiling of BMSCs in osteonecrosis of the femoral head associated with increased adipogenic and decreased osteogenic differentiation. Sci. Rep. 2018;8:9127. doi: 10.1038/s41598-018-27501-2. - DOI - PMC - PubMed

Publication types