. 2022 Aug 15;11(16):2533.
doi: 10.3390/cells11162533.

The Mechanical Microenvironment Regulates Axon Diameters Visualized by Cryo-Electron Tomography

Affiliations

The Mechanical Microenvironment Regulates Axon Diameters Visualized by Cryo-Electron Tomography

Di Ma et al. Cells. .

Abstract

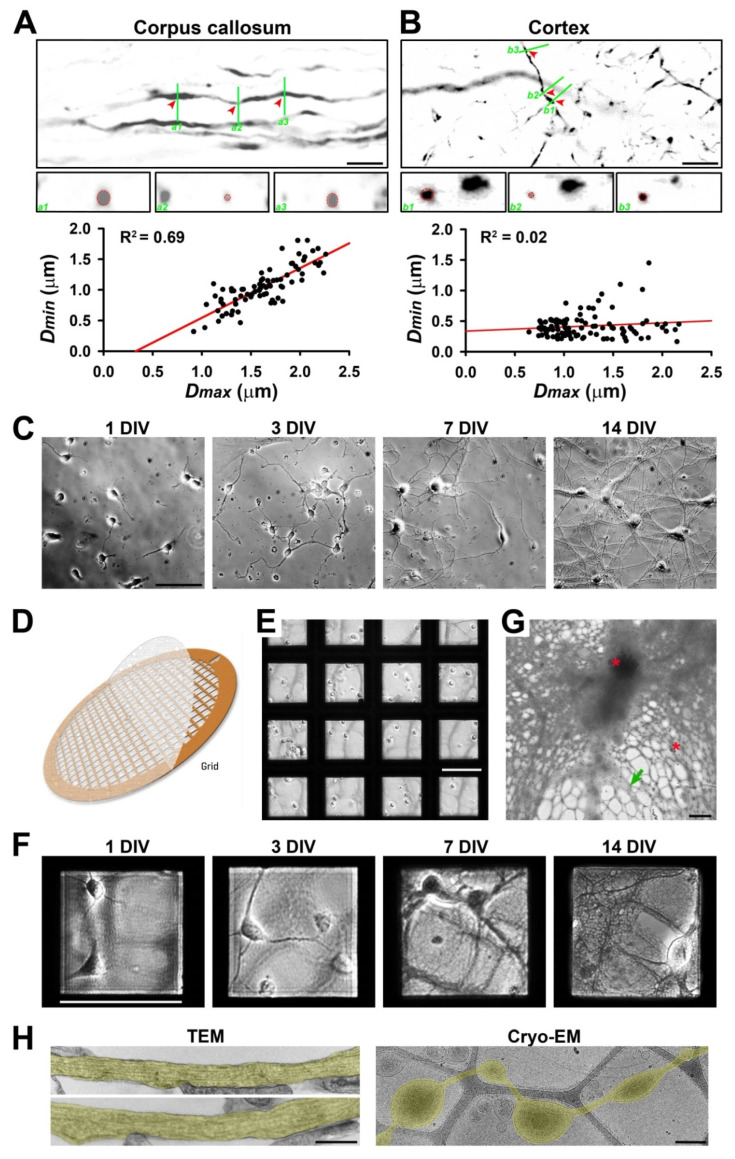
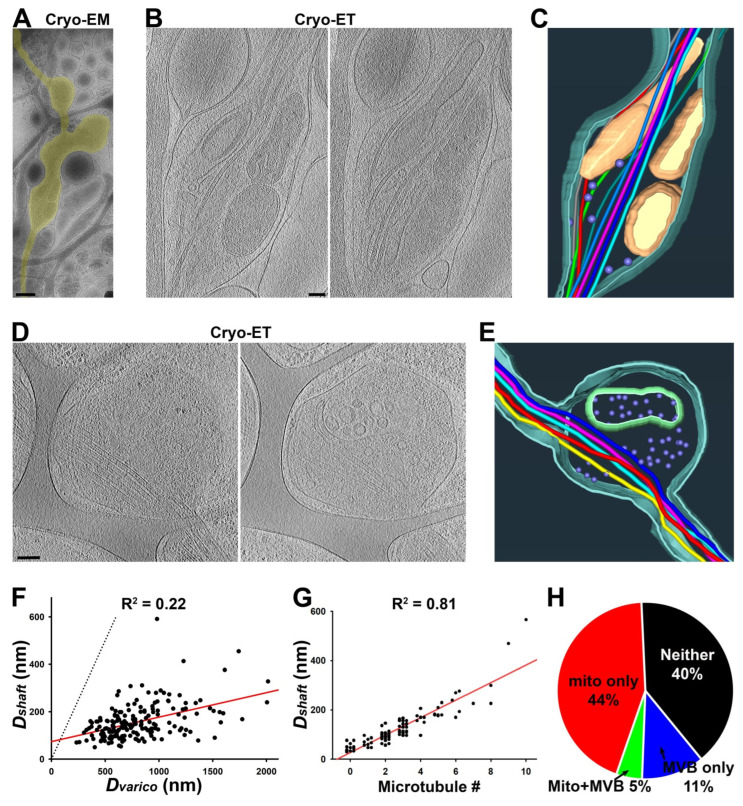
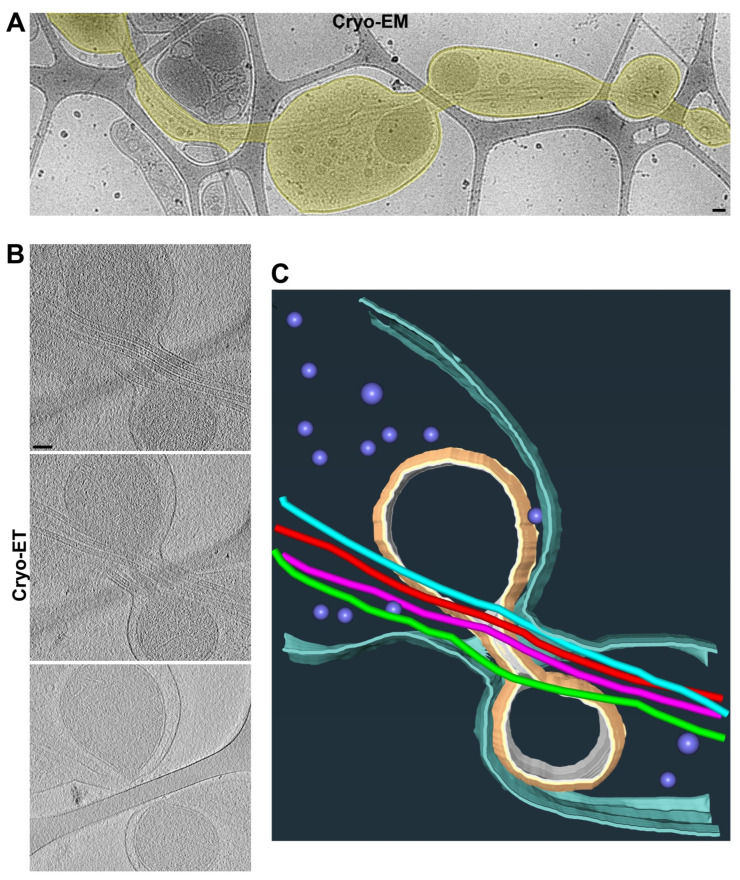
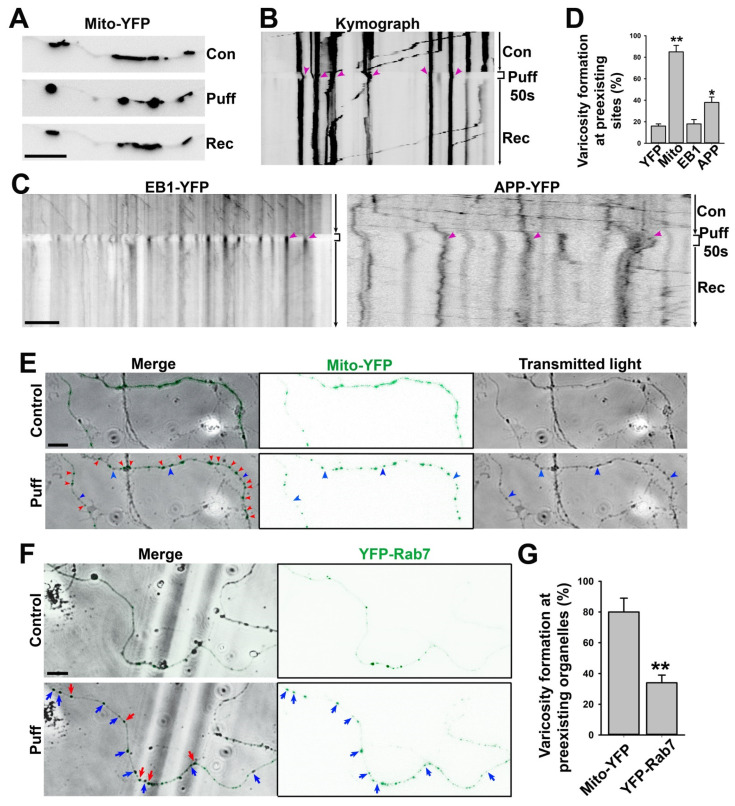
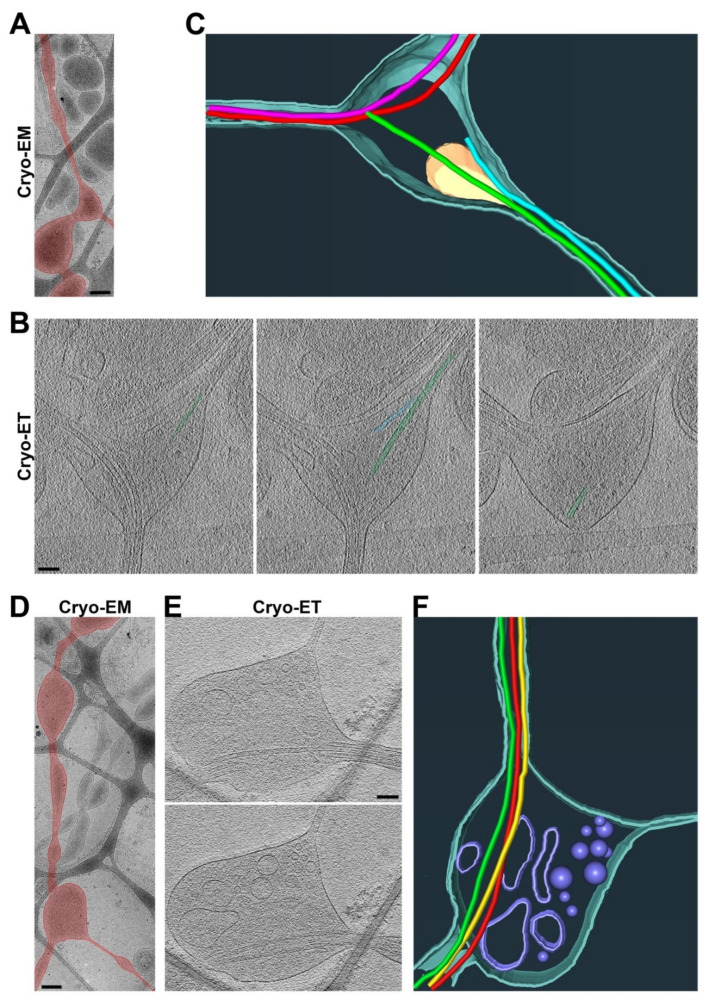
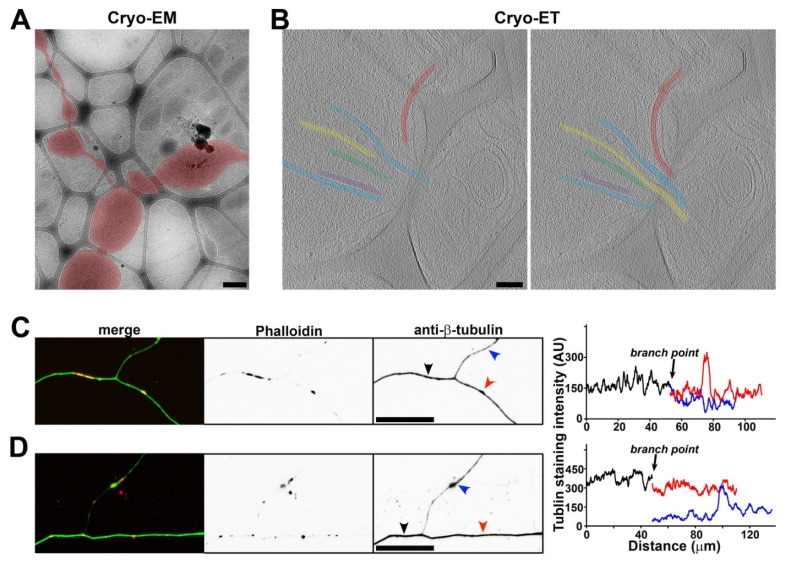
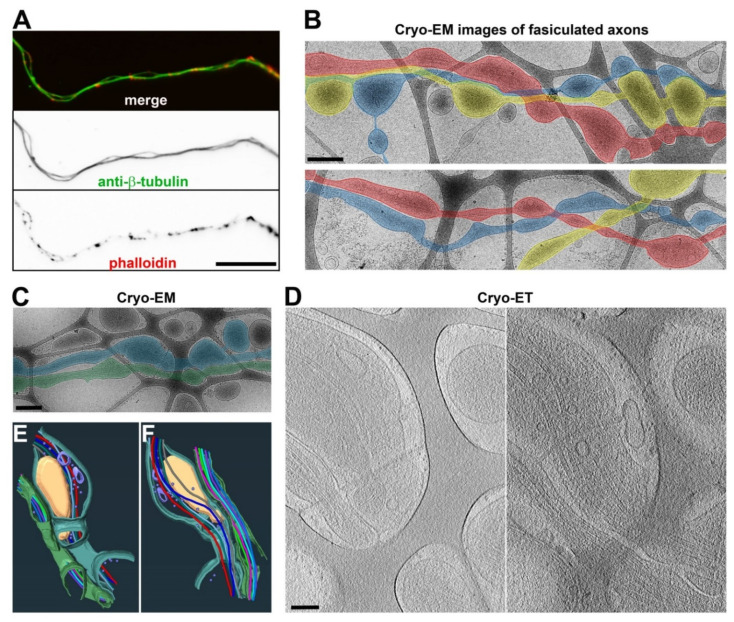
Axonal varicosities or swellings are enlarged structures along axon shafts and profoundly affect action potential propagation and synaptic transmission. These structures, which are defined by morphology, are highly heterogeneous and often investigated concerning their roles in neuropathology, but why they are present in the normal brain remains unknown. Combining confocal microscopy and cryo-electron tomography (Cryo-ET) with in vivo and in vitro systems, we report that non-uniform mechanical interactions with the microenvironment can lead to 10-fold diameter differences within an axon of the central nervous system (CNS). In the brains of adult Thy1-YFP transgenic mice, individual axons in the cortex displayed significantly higher diameter variation than those in the corpus callosum. When being cultured on lacey carbon film-coated electron microscopy (EM) grids, CNS axons formed varicosities exclusively in holes and without microtubule (MT) breakage, and they contained mitochondria, multivesicular bodies (MVBs), and/or vesicles, similar to the axonal varicosities induced by mild fluid puffing. Moreover, enlarged axon branch points often contain MT free ends leading to the minor branch. When the axons were fasciculated by mimicking in vivo axonal bundles, their varicosity levels reduced. Taken together, our results have revealed the extrinsic regulation of the three-dimensional ultrastructures of central axons by the mechanical microenvironment under physiological conditions.

Keywords: axon branch point; axon fasciculation; axonal varicosity; cryo-electron tomography (Cryo-ET); microtubule (MT); mitochondria; multivesicular body (MVB); primary neuron culture.


Conflict of interest statement

The authors declare no conflict of interest.

Figures

Figure 1
Figure 1
Diameter variation in individual axons correlates with the complexity of extracellular microenvironment. (A) Confocal images and 3D reconstruction of YFP+ (signals inverted in gray scale) axons in the corpus callosum of Thy1-YFP transgenic mice. In an XY focal plane (top), three green lines indicate the positions for three ZY focal planes (a1–a3, middle, enlarged by 2-fold) to show the diameters of three positions (indicated by red arrowheads) of a single axonal segment (circled in red dashes). Correlation between the largest diameter (Dmax) and the smallest diameter (Dmin) along a single continuous axonal segment is indicated by a black dot in the chart at the bottom. (B) Confocal images and 3D reconstruction of YFP+ axons in the cortical layer 6 of Thy1-YFP transgenic mice. The Dmin-Dmax correlation in the cortex is much less than that in the corpus callosum. (C) In vitro development of mouse hippocampal neurons cultured on coated glass coverslips. Neurons at 1, 3, 7, and 14 days in vitro (DIV) were visualized with transmitted light. (D) The diagram of an EM grid with lacey carbon film. (E) Neurons were just seeded on coated EM grids with lacey carbon film at 0 DIV. (F) In vitro development of hippocampal neurons cultured on EM grids. Neurons at 1, 3, 7, and 14 DIV were visualized with transmitted light. (G) Low-magnification Cryo-EM image of neuronal processes growing on coated lacey carbon film. Red asterisks, ice crystals. Green arrows, thin and isolated axons that can potentially be resolved in Cryo-ET. Blurry areas represent thick cellular structures. (H) TEM images of axons growing on a coated and uniform plastic surface (left) and Cryo-EM image of an axon growing on lacey carbon film (right). Axonal segments are highlighted in yellow. Scale bars: 10 μm in (A,B,G), 100 μm in (C,E,F), and 500 nm in (H).
Figure 2
Figure 2
Three-dimensional ultrastructures of axonal varicosities on lacey carbon film revealed by Cryo-ET. (A) Low-magnification Cryo-EM image of an axon (highlighted in yellow) growing on lacey carbon film. (B) Two slices from the Cryo-ET tomogram of the axonal varicosity. (C) Segmentation view of the varicosity in (B). MTs were represented in tubes of different colors: mitochondria in yellow, plasma membrane in cyan, and small vesicles in purple. (D) Two slices from the Cryo-ET tomogram of an axonal varicosity containing an MVB. (E) Segmentation view of the varicosity in (D). The outer membrane of the MVB is in green. (F) The correlation between the diameter of the axonal varicosity (Dvarico) and the diameter of its nearby shaft growing on top of carbon fiber (Dshaft). (G) The correlation between the diameter of the axonal shaft (Dshaft) and the number of its MTs. (H) Percentages of axonal varicosities containing mitochondria but not an MVB (red, 44%), MVB(s) but no mitochondria (blue, 11%), both mitochondria and an MVB (green, 5%), and neither mitochondria nor an MVB (black, 40%). n = 191. Scale bars, 500 nm in (A) and 100 nm in (B,D).
Figure 3
Figure 3
Two adjacent axonal varicosities with carbon fiber support in the middle. (A) Low-magnification view of an axonal segment with multiple varicosities growing on top of lacey carbon film. The axon is highlighted in yellow. (B) Three slices from the Cryo-ET tomogram of the junction of two axonal varicosities under high magnification. (C) Segmentation view of the varicosity junction in (B). Four MTs are represented as tubes of four different colors: mitochondria in yellow, plasma membrane in cyan, and small vesicles in purple. Scale bars, 100 nm.
Figure 4
Figure 4
Mitochondria are preferred sites for puffing-induced transient formation of axonal varicosities. (A) An axon expressing mito-YFP before (con), during (Puff), and after puffing (Rec). YFP fluorescence signals are inverted. (B) Kymograph of the movement of mito-YFP puncta along the axon in (A). Red arrowheads, YFP puncta after puffing located at the preexisting site. (C) Kymographs of EB1-YFP (left) and APP-YFP (right) movement along axons before, during, and after puffing. Most YFP punta were induced by puffing at new sites and slowly resolved afterwards. (D) Percentage of YPF puncta after puffing located at the same sites prior to puffing. One-way ANOVA followed by Dunnett’s test: *, p < 0.05; **, p < 0.01. n~12 for each condition. (E) Live-cell imaging for mito-YFP (green) and transmitted light before and after puffing during varicosity induction. Red arrowheads, varicosities formed at preexisting mito-YFP clusters. Blue arrowheads, varicosities formed at the sites without mito-YFP. (F) Live-cell imaging for YFP-Rab7 and transmitted light before and after puffing during varicosity induction. Red arrows, varicosities formed in preexisting YFP-Rab7 clusters. Blue arrows, varicosities formed at the sites without preexisting YFP-Rab7 clusters. (G) Summary of varicosity formation at preexisting mitochondria indicated by mito-YFP clusters (n = 10) and MVBs indicated by YFP-Rab7 clusters (n = 9). Unpaired t-test, **, p < 0.01. Scale bars, 15 μm.
Figure 5
Figure 5
Three-dimensional ultrastructures of two typical types of axon branch points. (A) Low-magnification Cryo-EM image of an axon and its branch point. An axon with a branch point is highlighted in red. (B) Three slices from the Cryo-ET tomogram of the axon branch point in (A). De novo formation of two MTs and their free ends for one branch are highlighted in green and cyan. (C) Segmentation view of the branch point in (B). Two MTs in red extending into one of the two daughter branches. Two MTs formed de novo within the branch point (one in green and the other in light blue) and extended into the other daughter branch. Mitochondria in yellow and plasma membrane in dark cyan. (D) Low-magnification Cryo-EM image of an axon branch point. The axon was highlighted in red. (E) Two slices from the Cryo-ET tomogram of the axon branch point in (D). One of the two daughter branches, the thin one, did not contain a single MT. (F) Segmentation view of the branch point in (E). Three MTs (in red, yellow, and green) all extended into one of the two daughter branches. Vesicles of different sizes in yellow and plasma membrane in cyan. Scale bars, 250 nm in (A,D) and 100 nm in (B,E).
Figure 6
Figure 6
Unequal splitting of MTs into two daughter branches. (A) Low-magnification Cryo-EM image of an axon branch point. The axon is highlighted in red. (B) Two slices from the Cryo-ET tomogram of the axon branch point in (A). Five out of six MTs (in different colors) extended into one daughter branch, while one MT (in red) extended into the other daughter branch (the thinner one). (C,D) Axons growing on coated cover glass were stained with an anti-β-tubulin antibody (green) and phalloidin (red). The line profiles of β-tubulin staining intensity along axon branches were plotted on the right. Black, the main branch. Red, one daughter branch. Blue, the relatively thinner daughter branch. Scale bars, 500 nm in (A), 100 nm in (B), and 50 μm in (C,D).
Figure 7
Figure 7
Three-dimensional ultrastructures of fasciculated axons. (A) Two fasciculated axons growing on coated glass coverslips stained with an anti-β-tubulin antibody (green) and phalloidin (red). (B) Low-magnification Cryo-EM images of fasciculated axons growing on top of lacey carbon film. Fasciculated axons are highlighted in blue, red, and yellow. (C) Low-magnification Cryo-EM image of two fasciculated axons (highlighted in blue and green) growing on top of lacey carbon film. (D) Two slices from the Cryo-ET tomogram of two fasciculated axons in (C). (E,F) Segmentation (bottom and top) views of two fasciculated axons in (D). MTs are shown with tubes of different colors: mitochondria in yellow, vesicles in purple, and plasma membranes in green and cyan. Scale bars, 25 μm in (A), 400 nm in (B,C), and 100 nm in (D).

Similar articles

Cited by

References

    1. Debanne D. Information processing in the axon. Nat. Rev. Neurosci. 2004;5:304–316. doi: 10.1038/nrn1397. - DOI - PubMed
    1. Gu C. Rapid and Reversible Development of Axonal Varicosities: A New Form of Neural Plasticity. Front. Mol. Neurosci. 2021;14:610857. doi: 10.3389/fnmol.2021.610857. - DOI - PMC - PubMed
    1. Browne K.D., Chen X.H., Meaney D.F., Smith D.H. Mild traumatic brain injury and diffuse axonal injury in swine. J. Neurotrauma. 2011;28:1747–1755. doi: 10.1089/neu.2011.1913. - DOI - PMC - PubMed
    1. Reeves T.M., Smith T.L., Williamson J.C., Phillips L.L. Unmyelinated axons show selective rostrocaudal pathology in the corpus callosum after traumatic brain injury. J. Neuropathol. Exp. Neurol. 2012;71:198–210. doi: 10.1097/NEN.0b013e3182482590. - DOI - PMC - PubMed
    1. Johnson V.E., Stewart W., Smith D.H. Axonal pathology in traumatic brain injury. Exp. Neurol. 2013;246:35–43. doi: 10.1016/j.expneurol.2012.01.013. - DOI - PMC - PubMed

Publication types

LinkOut - more resources