

Induced Human Regulatory T Cells Express the Glucagon-like Peptide-1 Receptor
- PMID: 36010663
- PMCID: PMC9406769
- DOI: 10.3390/cells11162587
Induced Human Regulatory T Cells Express the Glucagon-like Peptide-1 Receptor
Abstract
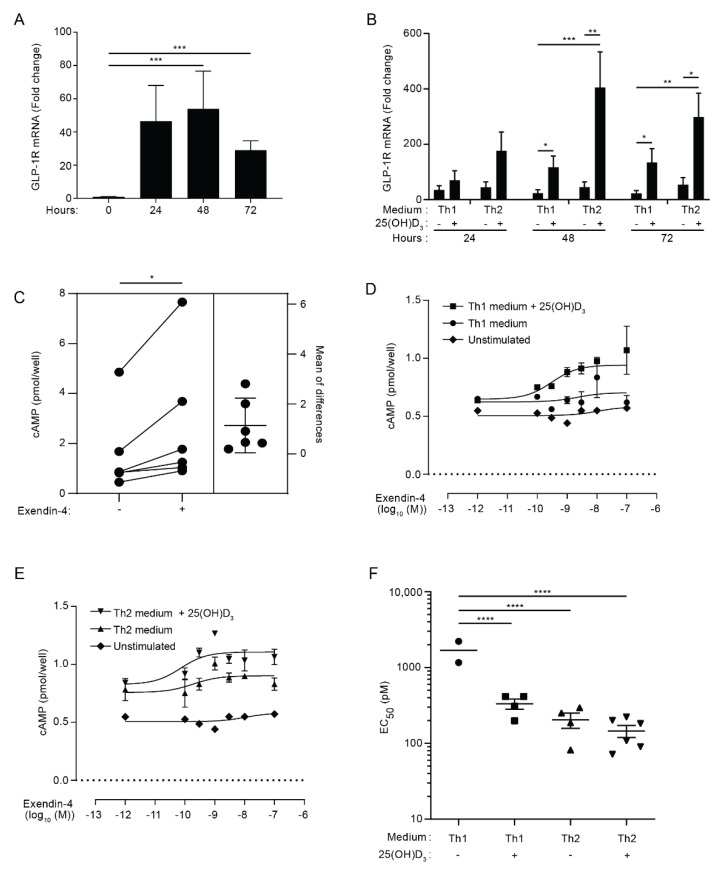
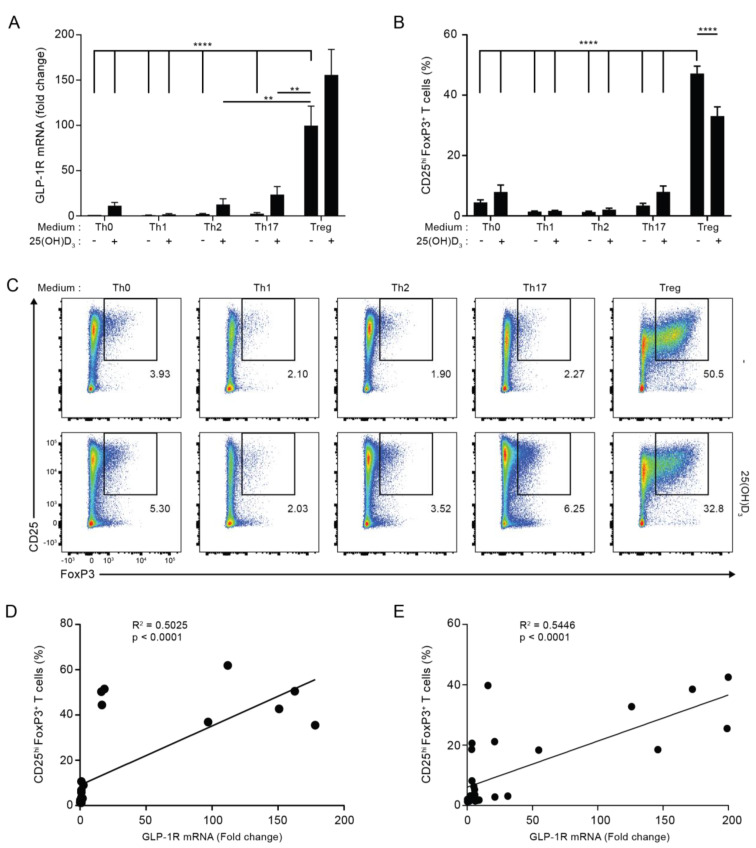
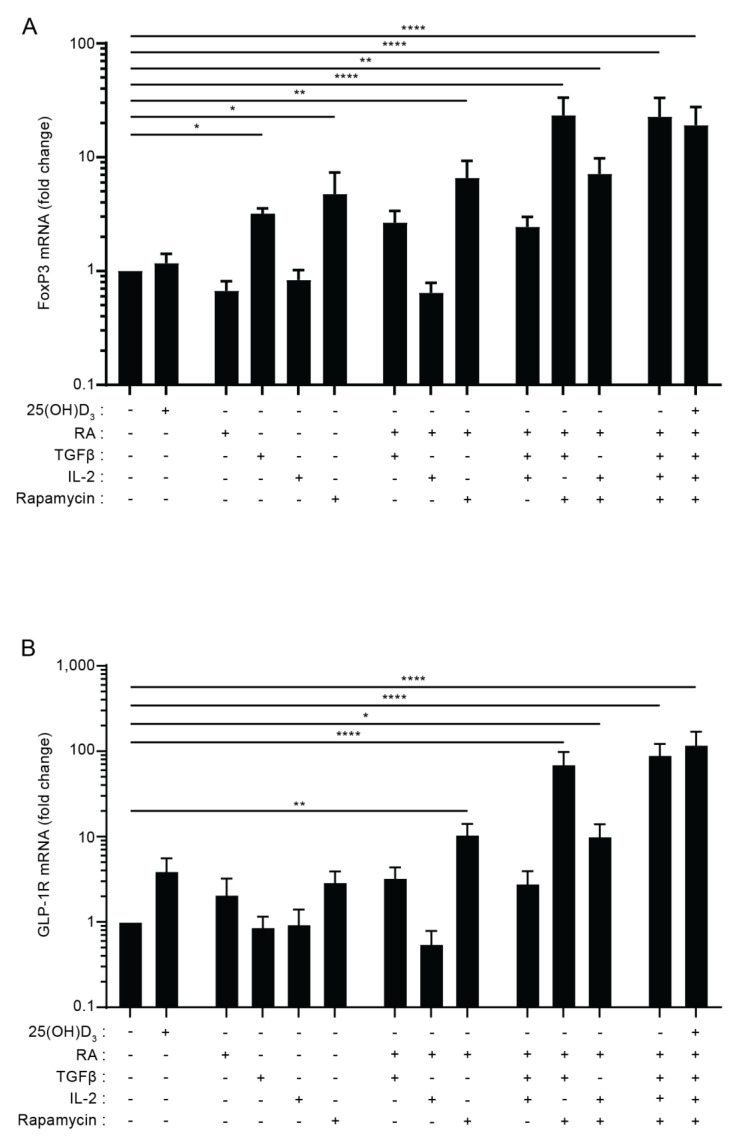
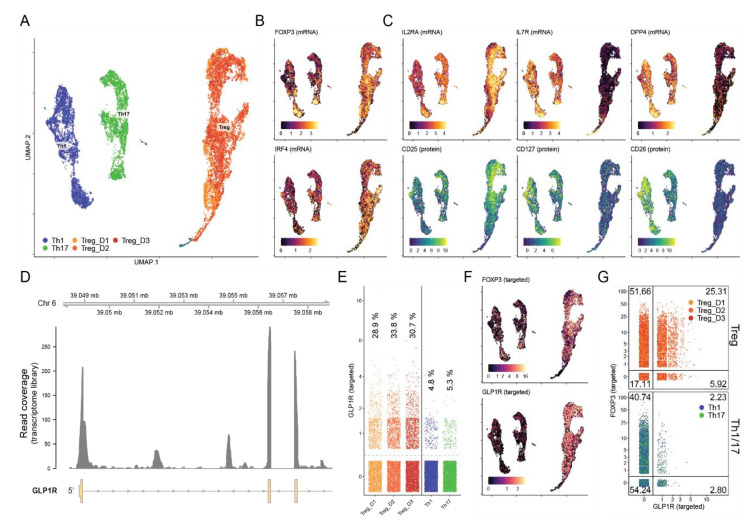
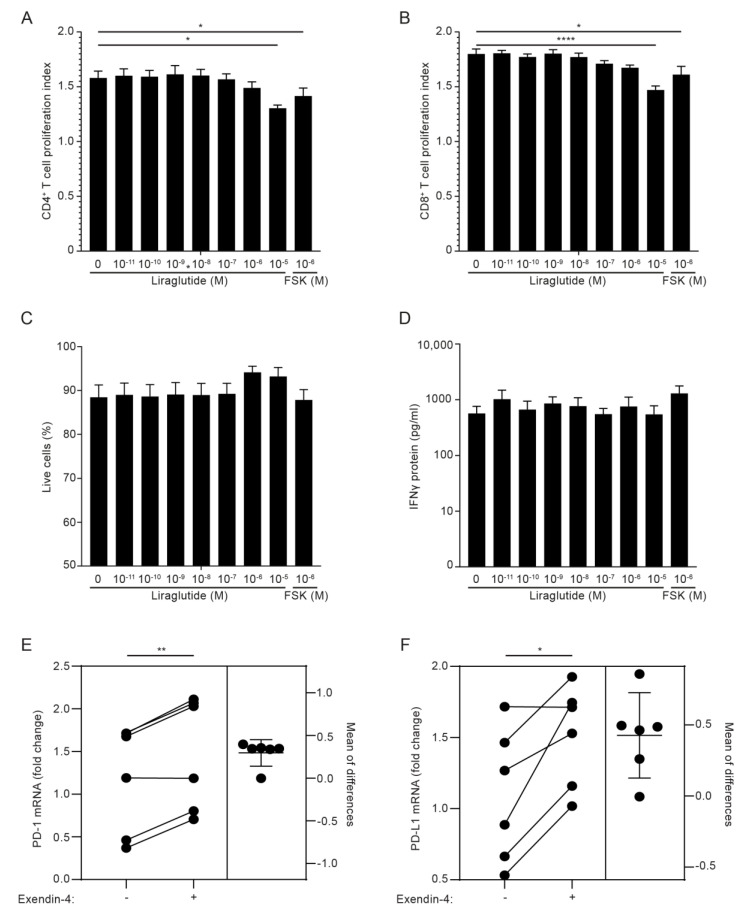
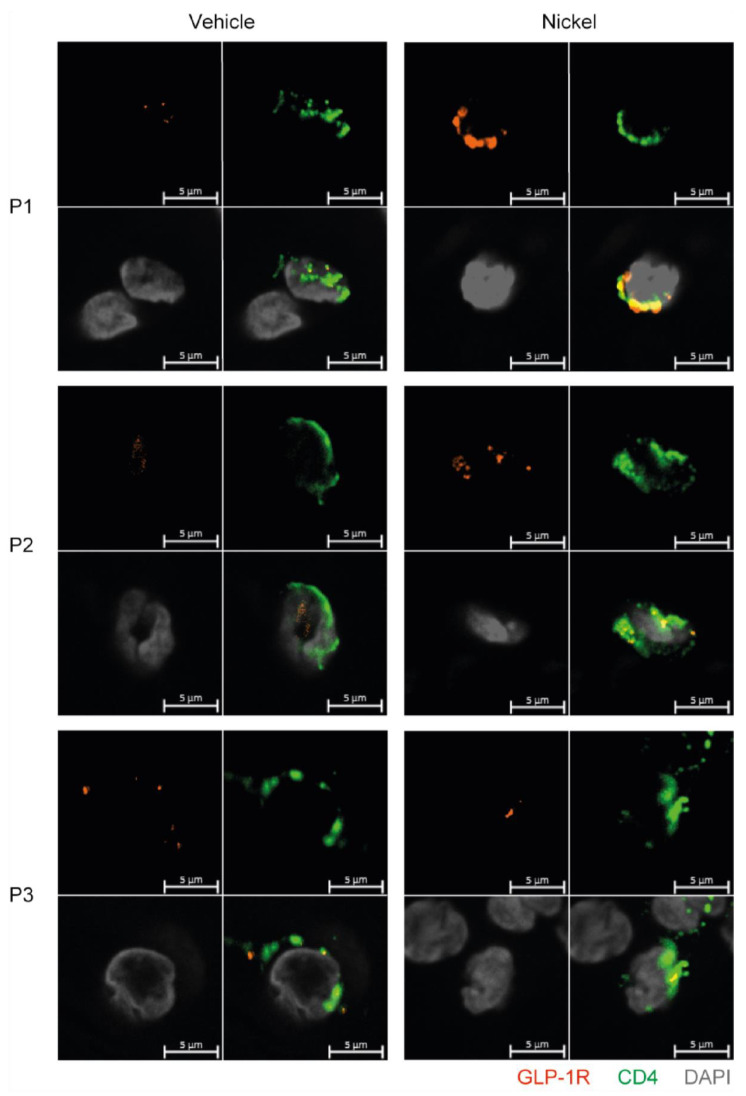
The glucagon-like peptide-1 receptor (GLP-1R) plays a key role in metabolism and is an important therapeutic target in diabetes and obesity. Recent studies in experimental animals have shown that certain subsets of T cells express functional GLP-1R, indicating an immune regulatory role of GLP-1. In contrast, less is known about the expression and function of the GLP-1R in human T cells. Here, we provide evidence that activated human T cells express GLP-1R. The expressed GLP-1R was functional, as stimulation with a GLP-1R agonist triggered an increase in intracellular cAMP, which was abrogated by a GLP-1R antagonist. Analysis of CD4+ T cells activated under T helper (Th) 1, Th2, Th17 and regulatory T (Treg) cell differentiation conditions indicated that GLP-1R expression was most pronounced in induced Treg (iTreg) cells. Through multimodal single-cell CITE- and TCR-sequencing, we detected GLP-1R expression in 29-34% of the FoxP3+CD25+CD127- iTreg cells. GLP-1R+ cells showed no difference in their TCR-gene usage nor CDR3 lengths. Finally, we demonstrated the presence of GLP-1R+CD4+ T cells in skin from patients with allergic contact dermatitis. Taken together, the present data demonstrate that T cell activation triggers the expression of functional GLP-1R in human CD4+ T cells. Given the high induction of GLP-1R in human iTreg cells, we hypothesize that GLP-1R+ iTreg cells play a key role in the anti-inflammatory effects ascribed to GLP-1R agonists in humans.
Keywords: CD4+ T cells; GLP-1R expression; human.
Conflict of interest statement
The authors declare that the research was conducted in the absence of any commercial or financial relationships that could be construed as a potential conflict of interest.
Figures
Similar articles
-
Glucagon-like peptide-1 receptor signalling selectively regulates murine lymphocyte proliferation and maintenance of peripheral regulatory T cells.Diabetologia. 2010 Apr;53(4):730-40. doi: 10.1007/s00125-009-1643-x. Epub 2010 Jan 8. Diabetologia. 2010. PMID: 20225396
-
Glucagon-like peptide-1 receptor action in the vasculature.Peptides. 2019 Jan;111:26-32. doi: 10.1016/j.peptides.2018.09.002. Epub 2018 Sep 15. Peptides. 2019. PMID: 30227157 Review.
-
Activation of Glucagon-Like Peptide-1 Receptor Promotes Neuroprotection in Experimental Autoimmune Encephalomyelitis by Reducing Neuroinflammatory Responses.Mol Neurobiol. 2018 Apr;55(4):3007-3020. doi: 10.1007/s12035-017-0550-2. Epub 2017 Apr 29. Mol Neurobiol. 2018. PMID: 28456941
-
Glucagon-like peptide-1 receptor mediated control of cardiac energy metabolism.Peptides. 2018 Feb;100:94-100. doi: 10.1016/j.peptides.2017.12.005. Peptides. 2018. PMID: 29412838 Review.
-
Progesterone receptor membrane component 1 is a functional part of the glucagon-like peptide-1 (GLP-1) receptor complex in pancreatic β cells.Mol Cell Proteomics. 2014 Nov;13(11):3049-62. doi: 10.1074/mcp.M114.040196. Epub 2014 Jul 20. Mol Cell Proteomics. 2014. PMID: 25044020 Free PMC article.
Cited by
-
Liraglutide and not lifestyle intervention reduces soluble CD163 after comparable weight loss in obese participants with prediabetes or type 2 diabetes mellitus.Cardiovasc Diabetol. 2024 Apr 29;23(1):146. doi: 10.1186/s12933-024-02237-8. Cardiovasc Diabetol. 2024. PMID: 38685051 Free PMC article.
-
GLP-1 receptor agonist as a modulator of innate immunity.Front Immunol. 2022 Dec 8;13:997578. doi: 10.3389/fimmu.2022.997578. eCollection 2022. Front Immunol. 2022. PMID: 36569936 Free PMC article. Review.
-
The Anti-Inflammatory Effects of Liraglutide in Equine Inflammatory Joint Models.J Orthop Res. 2025 May;43(5):893-903. doi: 10.1002/jor.26050. Epub 2025 Feb 4. J Orthop Res. 2025. PMID: 39904754 Free PMC article.
-
In vitro differentiated human CD4+ T cells produce hepatocyte growth factor.Front Immunol. 2023 Jul 13;14:1210836. doi: 10.3389/fimmu.2023.1210836. eCollection 2023. Front Immunol. 2023. PMID: 37520551 Free PMC article.
-
GLP-1 RAs and SGLT2i: two antidiabetic agents associated with immune and inflammation modulatory properties through the common AMPK pathway.Front Immunol. 2023 Nov 20;14:1163288. doi: 10.3389/fimmu.2023.1163288. eCollection 2023. Front Immunol. 2023. PMID: 38053992 Free PMC article. Review.
References
Publication types
MeSH terms
Substances
LinkOut - more resources
Full Text Sources
Research Materials
