. 2022 Aug 19;11(16):2591.
doi: 10.3390/cells11162591.

Developing a Reliable Holographic Flow Cyto-Tomography Apparatus by Optimizing the Experimental Layout and Computational Processing

Affiliations

Developing a Reliable Holographic Flow Cyto-Tomography Apparatus by Optimizing the Experimental Layout and Computational Processing

Jaromír Běhal et al. Cells. .

Abstract

Digital Holographic Tomography (DHT) has recently been established as a means of retrieving the 3D refractive index mapping of single cells. To make DHT a viable system, it is necessary to develop a reliable and robust holographic apparatus in order that such technology can be utilized outside of specialized optics laboratories and operated in the in-flow modality. In this paper, we propose a quasi-common-path lateral-shearing holographic optical set-up to be used, for the first time, for DHT in a flow-cytometer modality. The proposed solution is able to withstand environmental vibrations that can severely affect the interference process. Furthermore, we have scaled down the system while ensuring that a full 360° rotation of the cells occurs in the field-of-view, in order to retrieve 3D phase-contrast tomograms of single cells flowing along a microfluidic channel. This was achieved by setting the camera sensor at 45° with respect to the microfluidic direction. Additional optimizations were made to the computational elements to ensure the reliable retrieval of 3D refractive index distributions by demonstrating an effective method of tomographic reconstruction, based on high-order total variation. The results were first demonstrated using realistic 3D numerical phantom cells to assess the performance of the proposed high-order total variation method in comparison with the gold-standard algorithm for tomographic reconstructions: namely, filtered back projection. Then, the proposed DHT system and the processing pipeline were experimentally validated for monocytes and mouse embryonic fibroblast NIH-3T3 cells lines. Moreover, the repeatability of these tomographic measurements was also investigated by recording the same cell multiple times and quantifying the ability to provide reliable and comparable tomographic reconstructions, as confirmed by a correlation coefficient greater than 95%. The reported results represent various steps forward in several key aspects of in-flow DHT, thus paving the way for its use in real-world applications.

Keywords: holographic microscopy; phase-contrast tomography; single-cells analysis.


Conflict of interest statement

The authors declare no conflict of interest.

Figures

Figure 1
Figure 1
(a) Sketch of experimental arrangement. MO—microscope objective; MC—microfluidic chip; Ms—mirrors; I—iris diaphragm; BS—beam splitter; CMOS—camera; SD—shearing device. The image in front of the MO provides a zoom into the MC with cells rolling on the channel-side wall. Inserts in front of the CMOS illustrate replicas arising from the SD. The highlighted image portions (area1 and area2) represent overlapping areas detected by the CMOS, providing correct holographic performance. (b) Interference snapshot with a cell flowing inside the diagonally oriented (45 degrees) microfluidic channel. The zoom of the interference fringes is reported as inset within the draw of the magnifying glass.
Figure 2
Figure 2
Steps of numerical processing. (a) recorded hologram, (b) Fourier spectrum, (c) reconstructed amplitude (d) reconstructed wrapped-phase distribution, (e) TSI used to individuate the θ = 360° phase map, including unwrapped phase images, (f) scheme illustrating the coordinate system and parameters for the rolling angle retrieval.
Figure 3
Figure 3
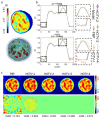
Monocyte simulation. (a) 3D (top) and isolevel (bottom) visualization of the simulated monocite, (b) horizontal cut through the central slice of the reconstructed tomograms for Δθ = 6° and Δθ = 16°, considering different solvers, (c) top row: central slice of the reconstructed tomograms considering different solvers for Δθ=16°, bottom row: difference slice between the reconstructions obtained with different solvers and the simulated model. Length of the reference scale bar is 5 µm.
Figure 4
Figure 4
Tomograms of the four different monocytes examined. For every panel (ad), cross-section slices from the HOTV-2 tomographic reconstruction (subfigures a1d1), cross-section slices from the FBP tomographic reconstruction (subfigures a2d2), and the absolute value of the difference between the two cross-section slices (subfigures a3d3) are presented, together with isolevel visualizations for the HOTV-2 (subfigures a4d4) and FBP reconstructions (subfigures a5d5). The length of the reference scale bar is 5 µm.
Figure 5
Figure 5
Histograms computed over the monocytes under examination; (a) average refractive index, (b) biovolume, (c) equivalent diameter, (d) dry mass.
Figure 6
Figure 6
Tomograms of two NIH-3T3 cells. For both panels (a,b), cross-section slices from the HOTV-2 tomographic reconstruction (subfigures a1,b1), cross-section slices from the FBP tomographic reconstruction (subfigures a2,b2), and the absolute value of the difference between the two cross-section slices (subfigures a3,b3) are presented, together with isolevel visualizations for the HOTV-2 (subfigures a4,b4) and FBP reconstructions (subfigures a5,b5). (c) Histograms of average refractive index, biovolume, equivalent diameter, and dry mass, computed over the NIH-3T3 under examination.
Figure 7
Figure 7
Data analysis comparing monocytes and NIH-3T3 cell lines; (af) display the scatterplots between each pair of the conventional morphology features calculated for the analyzed cell lines, i.e., average RI, dry mass, biovolume, and equivalent diameter. In particular, the subfigure (f) shows a quasi-linear trend, due to the obvious correlation between biovolume and equivalent diameter. This renders redundant the information content provided by the pair of subfigures (b) and (d) as well as (c) and (e), which display similar population distributions. Reported in (g,h) are two of the most popular methods for inspecting high-dimensional data, i.e. PCA analysis and the T-SNE visualization, respectively; these have the effect of removing such redundancy and show the spatial separation of the two analyzed cell populations, thus demonstrating the possibility of clustering them.
Figure 8
Figure 8
(ac) Repeatability of the experimental reconstruction process. (a) Comparison between reconstructions of the same tomograms for five different observations of the same cell [A–E] which is rotated five times through the channel: central (top row) and peripheral (bottom row) x-z slices of the tomograms obtained by HOTV-2; (b) retrieved angular sequences for the five considered experiments; (c) correlation matrix calculated between the tomograms reconstructed for the five considered independent observations.

Similar articles

Cited by

References

    1. Shields IV C.W., Reyes C.D., López G.P. Microfluidic cell sorting: A review of the advances in the separation of cells from debulking to rare cell isolation. Lab Chip. 2015;15:1230–1249. doi: 10.1039/C4LC01246A. - DOI - PMC - PubMed
    1. Galanzha E.I., Shashkov E.V., Tuchin V.V., Zharov V.P. In vivo multispectral, multiparameter, photoacoustic lymph flow cytometry with natural cell focusing, label-free detection and multicolor nanoparticle probes. Cytom. A. 2008;73:884–894. doi: 10.1002/cyto.a.20587. - DOI - PMC - PubMed
    1. Zhang A.C., Gu Y., Han Y., Mei Z., Chiu Y.J., Geng L., Cho S.H., Lo Y.H. Computational cell analysis for label-free detection of cell properties in a microfluidic laminar flow. Analyst. 2016;141:4142–4150. doi: 10.1039/C6AN00295A. - DOI - PMC - PubMed
    1. Song C., Jin T., Yan R., Qi W., Huang T., Ding H., Tan S.H., Nguyen N.T., Xi L. Opto-acousto-fluidic microscopy for three-dimensional label-free detection of droplets and cells in microchannels. Lab. Chip. 2018;18:1292–1297. doi: 10.1039/C8LC00106E. - DOI - PubMed
    1. Golichenari B., Velonia K., Nosrati R., Nezami A., Farokhi-Fard A., Abnous K., Behravan J., Tsatsakis A.M. Label-free nano-biosensing on the road to tuberculosis detection. Biosens. Bioelectron. 2018;113:124–135. doi: 10.1016/j.bios.2018.04.059. - DOI - PubMed

Publication types

LinkOut - more resources