

Cognitive Decline and BPSD Are Concomitant with Autophagic and Synaptic Deficits Associated with G9a Alterations in Aged SAMP8 Mice
- PMID: 36010679
- PMCID: PMC9406492
- DOI: 10.3390/cells11162603
Cognitive Decline and BPSD Are Concomitant with Autophagic and Synaptic Deficits Associated with G9a Alterations in Aged SAMP8 Mice
Abstract
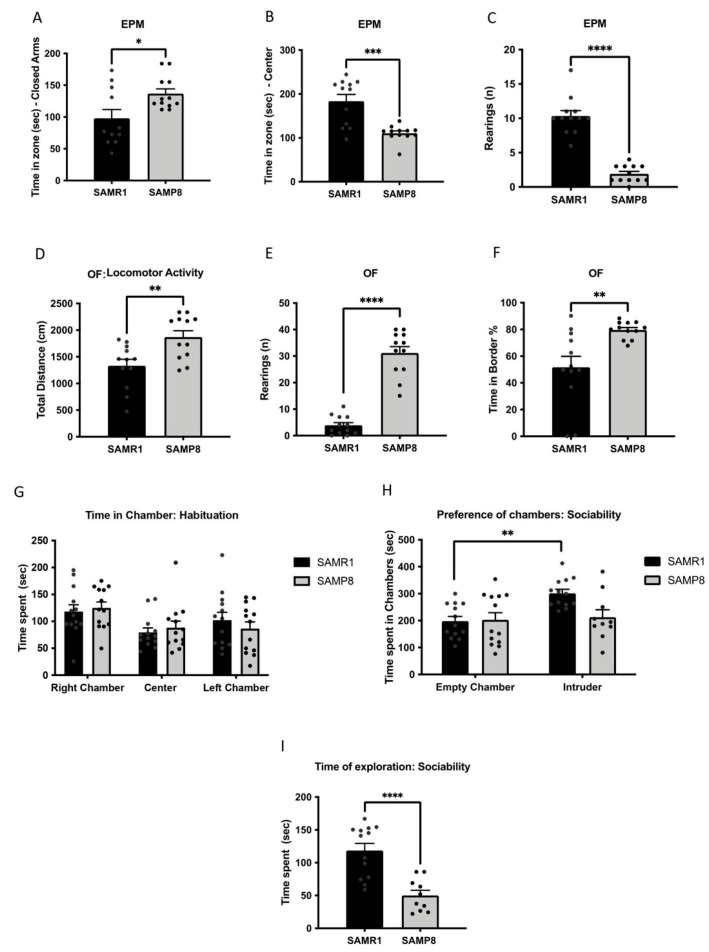
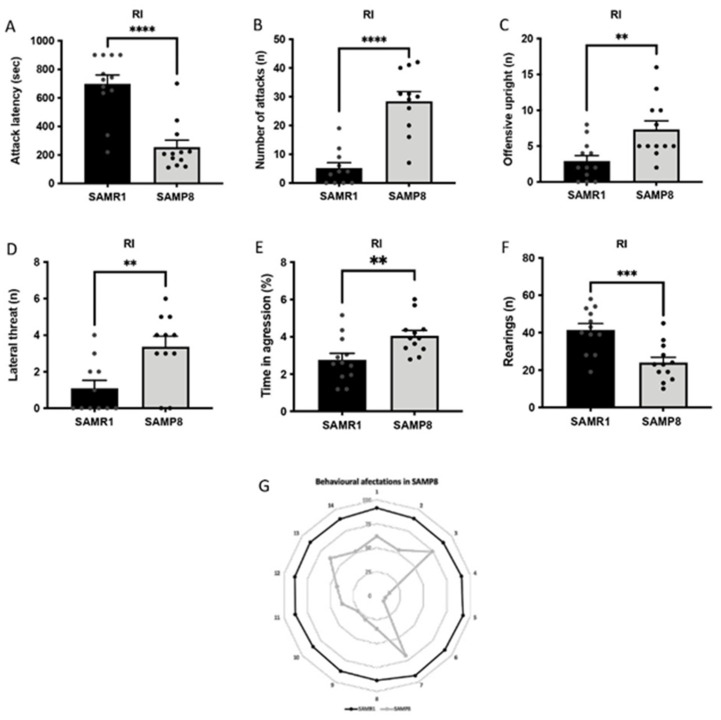
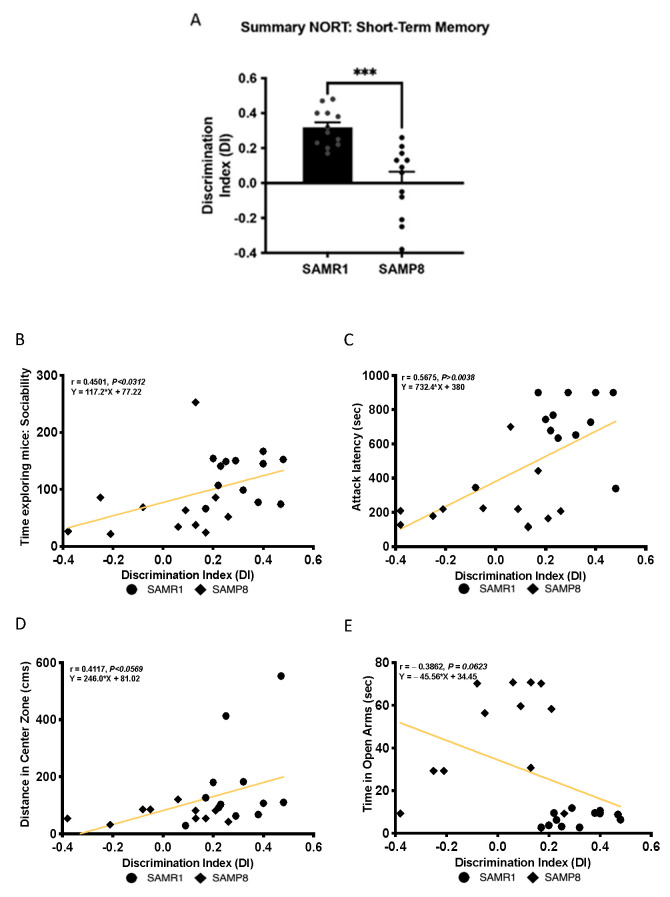
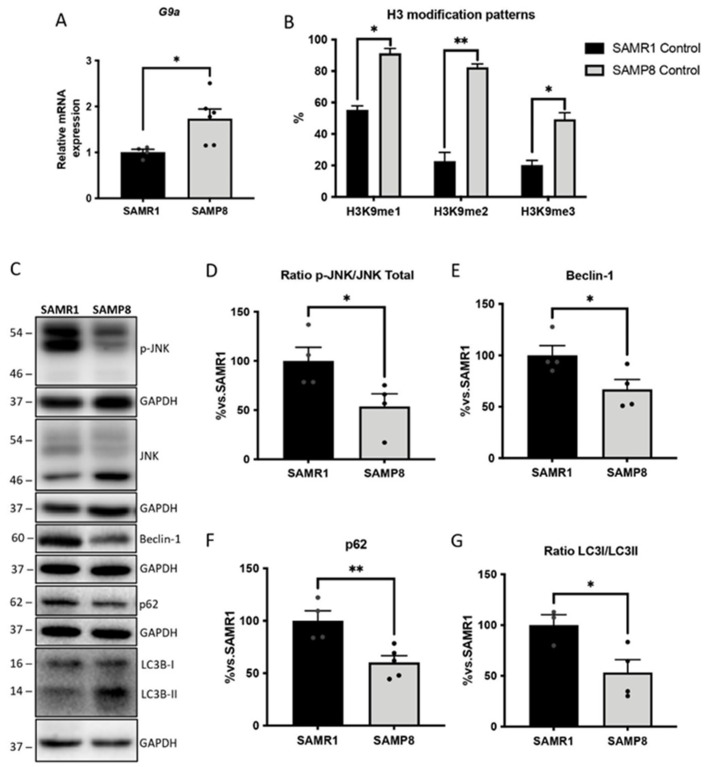
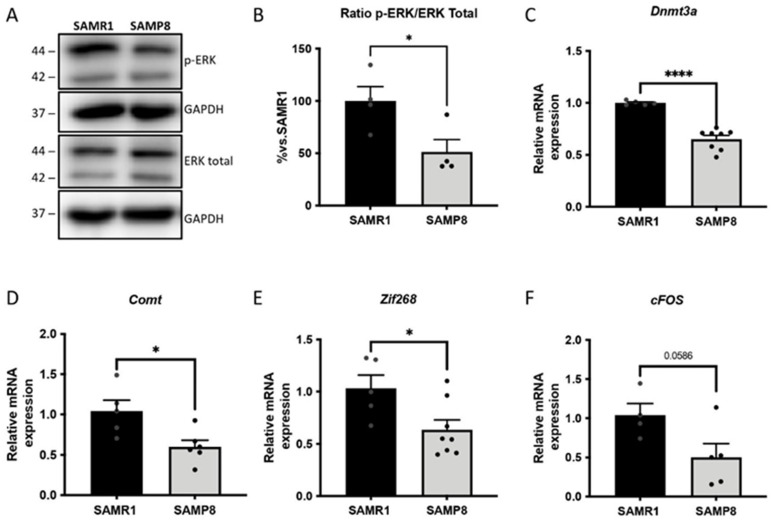
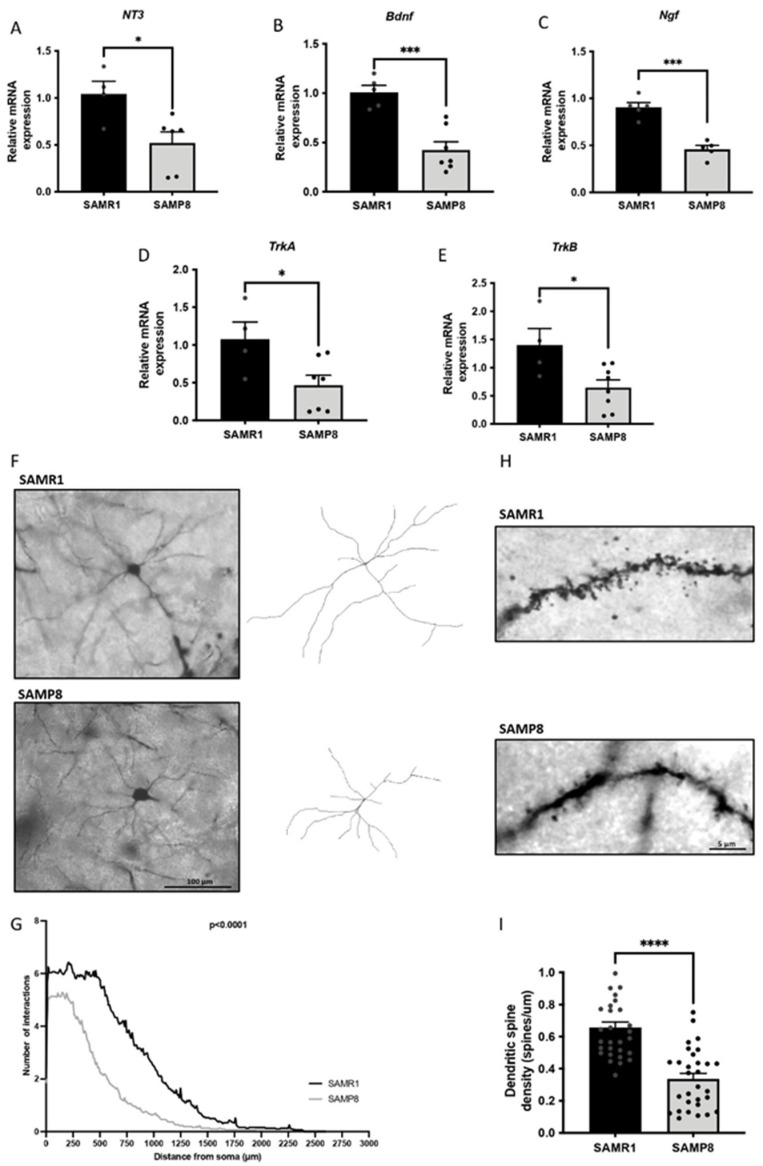
Behavioural and psychological symptoms of dementia (BPSD) are presented in 95% of Alzheimer's Disease (AD) patients and are also associated with neurotrophin deficits. The molecular mechanisms leading to age-related diseases are still unclear; however, emerging evidence has suggested that epigenetic modulation is a key pathophysiological basis of ageing and neurodegeneration. In particular, it has been suggested that G9a methyltransferase and its repressive histone mark (H3K9me2) are important in shaping learning and memory by modulating autophagic activity and synaptic plasticity. This work deepens our understanding of the epigenetic mechanisms underlying the loss of cognitive function and BPSD in AD. For this purpose, several tasks were performed to evaluate the parameters of sociability (three-chamber test), aggressiveness (resident intruder), anxiety (elevated plus maze and open field) and memory (novel object recognition test) in mice, followed by the evaluation of epigenetic, autophagy and synaptic plasticity markers at the molecular level. The behavioural alterations presented by senescence-accelerated mice prone 8 (SAMP8) of 12 months of age compared with their senescence-accelerated mouse resistant mice (SAMR1), the healthy control strain was accompanied by age-related cognitive deficits and alterations in epigenetic markers. Increased levels of G9a are concomitant to the dysregulation of the JNK pathway in aged SAMP8, driving a failure in autophagosome formation. Furthermore, lower expression of the genes involved in the memory-consolidation process modulated by ERK was observed in the aged male SAMP8 model, suggesting the implication of G9a. In any case, two of the most important neurotrophins, namely brain-derived neurotrophic factor (Bdnf) and neurotrophin-3 (NT3), were found to be reduced, along with a decrease in the levels of dendritic branching and spine density presented by SAMP8 mice. Thus, the present study characterizes and provides information regarding the non-cognitive and cognitive states, as well as molecular alterations, in aged SAMP8, demonstrating the AD-like symptoms presented by this model. In any case, our results indicate that higher levels of G9a are associated with autophagic deficits and alterations in synaptic plasticity, which could further explain the BPSD and cognitive decline exhibited by the model.
Keywords: BPSD; G9a; SAMP8; aggressivity; autophagy; cognitive decline; epigenetics.
Conflict of interest statement
The authors declare no conflict of interest.
Figures
Similar articles
-
Early sirtuin 2 inhibition prevents age-related cognitive decline in a senescence-accelerated mouse model.Neuropsychopharmacology. 2020 Jan;45(2):347-357. doi: 10.1038/s41386-019-0503-8. Epub 2019 Aug 30. Neuropsychopharmacology. 2020. PMID: 31471557 Free PMC article.
-
Amelioration of BPSD-Like Phenotype and Cognitive Decline in SAMP8 Mice Model Accompanied by Molecular Changes after Treatment with I2-Imidazoline Receptor Ligand MCR5.Pharmaceutics. 2020 May 23;12(5):475. doi: 10.3390/pharmaceutics12050475. Pharmaceutics. 2020. PMID: 32456135 Free PMC article.
-
Multi-strain probiotics ameliorate Alzheimer's-like cognitive impairment and pathological changes through the AKT/GSK-3β pathway in senescence-accelerated mouse prone 8 mice.Brain Behav Immun. 2024 Jul;119:14-27. doi: 10.1016/j.bbi.2024.03.031. Epub 2024 Mar 26. Brain Behav Immun. 2024. PMID: 38548184
-
SAMP8 Mice as a Model of Age-Related Cognition Decline with Underlying Mechanisms in Alzheimer's Disease.J Alzheimers Dis. 2020;75(2):385-395. doi: 10.3233/JAD-200063. J Alzheimers Dis. 2020. PMID: 32310176 Review.
-
The senescence-accelerated prone mouse (SAMP8): a model of age-related cognitive decline with relevance to alterations of the gene expression and protein abnormalities in Alzheimer's disease.Exp Gerontol. 2005 Oct;40(10):774-83. doi: 10.1016/j.exger.2005.05.007. Epub 2005 Jul 18. Exp Gerontol. 2005. PMID: 16026957 Review.
Cited by
-
Panax notoginseng saponins prevent dementia and oxidative stress in brains of SAMP8 mice by enhancing mitophagy.BMC Complement Med Ther. 2024 Apr 4;24(1):144. doi: 10.1186/s12906-024-04403-7. BMC Complement Med Ther. 2024. PMID: 38575939 Free PMC article.
-
Probing the relevance of the accelerated aging mouse line SAMP8 as a model for certain types of neuropsychiatric symptoms in dementia.Front Psychiatry. 2023 Feb 21;14:1054163. doi: 10.3389/fpsyt.2023.1054163. eCollection 2023. Front Psychiatry. 2023. PMID: 36896346 Free PMC article.
-
Differential Epigenetic Changes in the Dorsal Hippocampus of Male and Female SAMP8 Mice: A Preliminary Study.Int J Mol Sci. 2023 Aug 23;24(17):13084. doi: 10.3390/ijms241713084. Int J Mol Sci. 2023. PMID: 37685895 Free PMC article.
-
Neuroprotective effects of G9a inhibition through modulation of peroxisome-proliferator activator receptor gamma-dependent pathways by miR-128.Neural Regen Res. 2024 Nov 1;19(11):2532-2542. doi: 10.4103/1673-5374.393102. Epub 2024 Jan 8. Neural Regen Res. 2024. PMID: 38526289 Free PMC article.
-
Repurposing of Raltitrexed as an Effective G9a/EHMT2 Inhibitor and Promising Anti-Alzheimer's Agent.ACS Med Chem Lett. 2023 Oct 12;14(11):1531-1536. doi: 10.1021/acsmedchemlett.3c00344. eCollection 2023 Nov 9. ACS Med Chem Lett. 2023. PMID: 37974951 Free PMC article.
References
Publication types
MeSH terms
Substances
LinkOut - more resources
Full Text Sources
Medical
Research Materials
Miscellaneous
