. 2022 Aug 22;11(16):2615.
doi: 10.3390/cells11162615.

Pathogenetic Mechanisms Underlying Spinocerebellar Ataxia Type 3 Are Altered in Primary Oligodendrocyte Culture

Affiliations

Pathogenetic Mechanisms Underlying Spinocerebellar Ataxia Type 3 Are Altered in Primary Oligodendrocyte Culture

Kristen H Schuster et al. Cells. .

Abstract

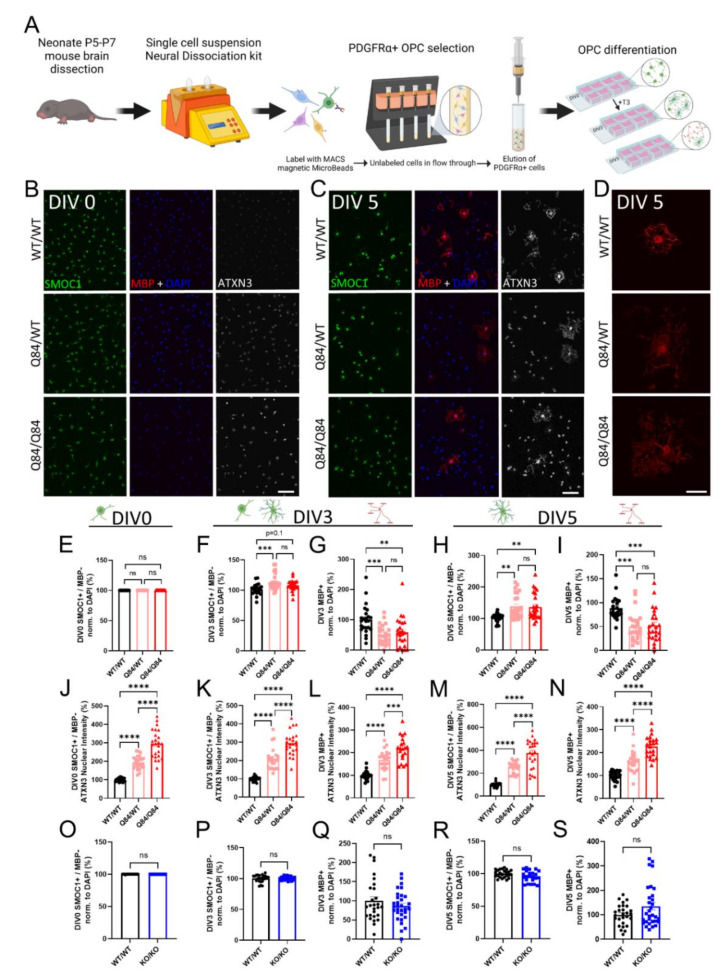
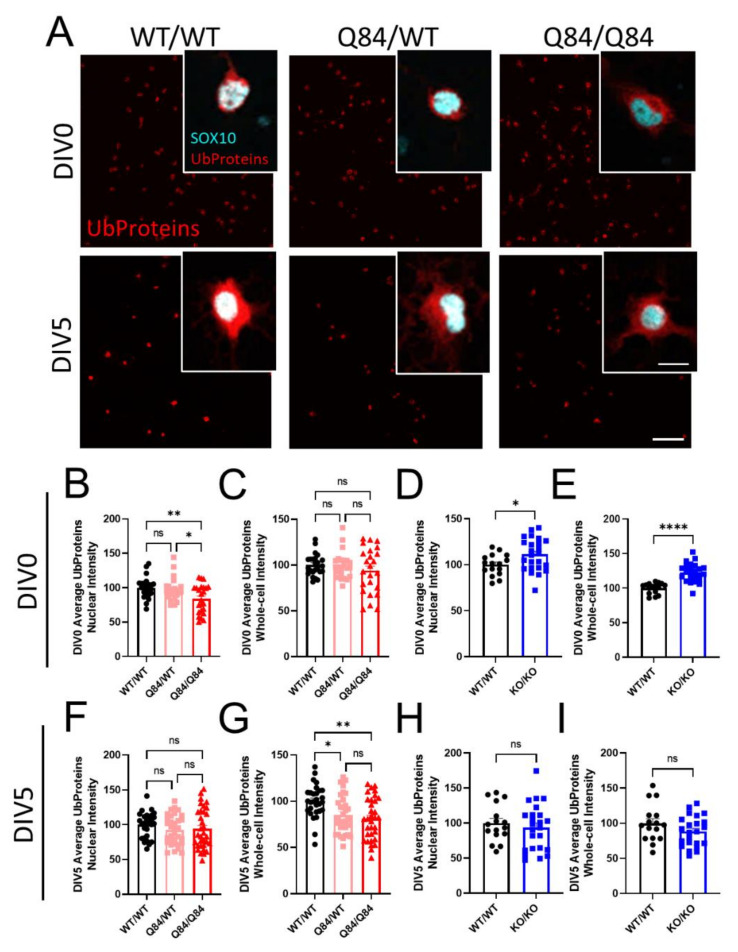
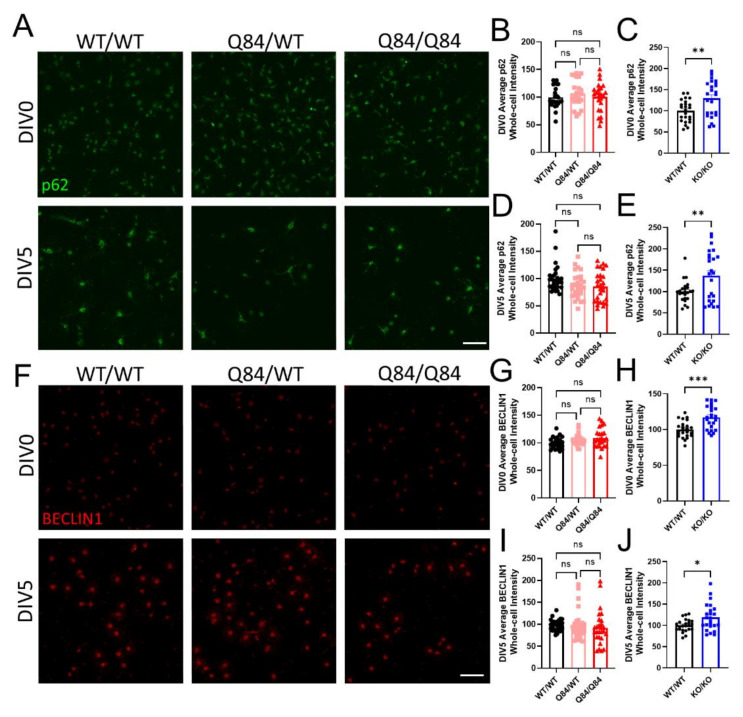
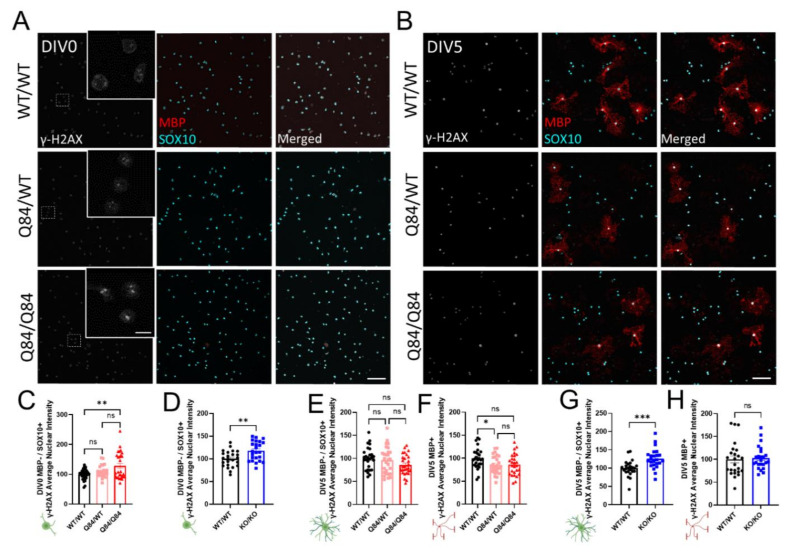
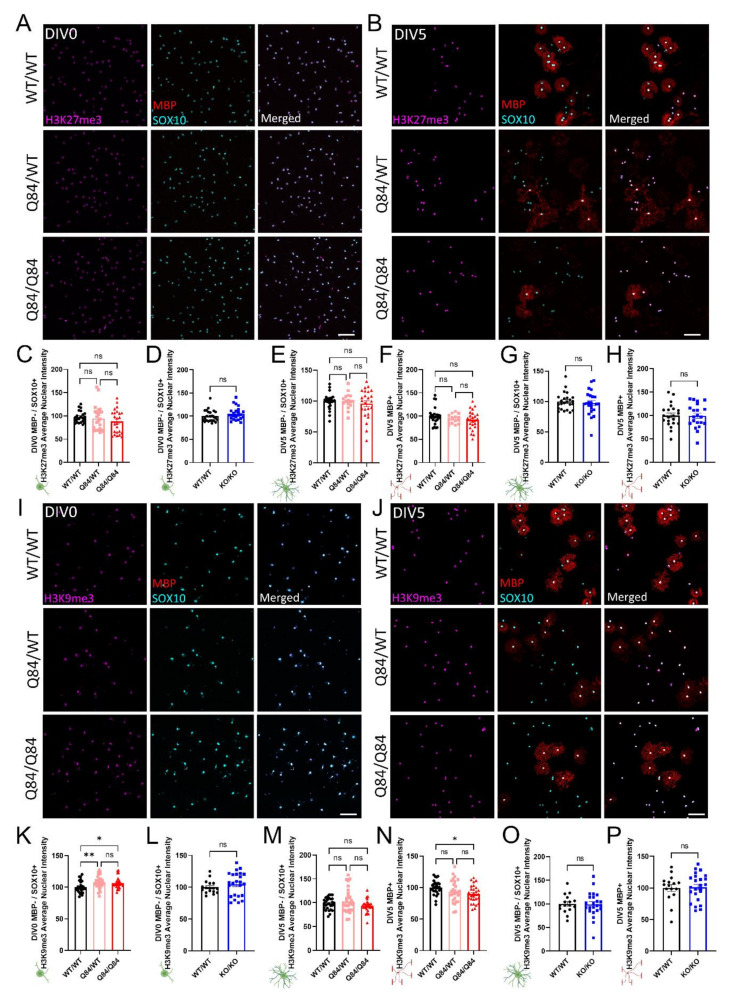
Emerging evidence has implicated non-neuronal cells, particularly oligodendrocytes, in the pathophysiology of many neurodegenerative diseases, including Alzheimer's disease, Parkinson's disease, amyotrophic lateral sclerosis, Huntington's disease and Spinocerebellar ataxia type 3 (SCA3). We recently demonstrated that cell-autonomous dysfunction of oligodendrocyte maturation is one of the of the earliest and most robust changes in vulnerable regions of the SCA3 mouse brain. However, the cell- and disease-specific mechanisms that underlie oligodendrocyte dysfunction remain poorly understood and are difficult to isolate in vivo. In this study, we used primary oligodendrocyte cultures to determine how known pathogenic SCA3 mechanisms affect this cell type. We isolated oligodendrocyte progenitor cells from 5- to 7-day-old mice that overexpress human mutant ATXN3 or lack mouse ATXN3 and differentiated them for up to 5 days in vitro. Utilizing immunocytochemistry, we characterized the contributions of ATXN3 toxic gain-of-function and loss-of-function in oligodendrocyte maturation, protein quality pathways, DNA damage signaling, and methylation status. We illustrate the utility of primary oligodendrocyte culture for elucidating cell-specific pathway dysregulation relevant to SCA3. Given recent work demonstrating disease-associated oligodendrocyte signatures in other neurodegenerative diseases, this novel model has broad applicability in revealing mechanistic insights of oligodendrocyte contribution to pathogenesis.

Keywords: Machado–Joseph disease; ataxia; myelination; oligodendrocyte; oligodendrocyte precursor cells; polyglutamine; spinocerebellar ataxia type 3.


Conflict of interest statement

The authors declare no conflict of interest.

Figures

Figure 1
Figure 1
ATXN3 gain of toxic function, but not loss of function, leads to cell-autonomous oligodendrocyte maturation impairments. (A) Schematic of primary OPC isolation and culture. (B,C) Representative immunofluorescent images of SMOC1 (green), MBP (red), ATXN3 (white), and DAPI (blue) expression in cultured WT/WT, Q84/WT, and Q84/Q84 oligodendrocytes prior to differentiation (DIV0) (B) and after 5 days of differentiation (+T3, DIV5) (C). Scale bar, 100 µm. (D) Representative high magnification images of MBP staining of cultured WT/WT, Q84/WT, and Q84/Q84 oligodendrocytes depict irregular branching in Q84 cells. Scale bar: 25 µm. (E,F,G) Cell counts of immature oligodendrocytes (SMOC1+/MBP−) at DIV0 (E), DIV3 (F), and DIV5 (H). (G,I) Cell counts of mature oligodendrocytes (MBP+) at DIV3 (G) and DIV5 (I). No differences in cell counts were found at DIV0, however, at DIV3 and DIV5, immature oligodendrocytes were increased and mature oligodendrocytes were significantly decreased in diseased mice. (J) Quantification of average ATXN3 nuclear intensity in Q84 OPCs at DIV0. (KN) Quantification of average ATXN3 intensity in Q84 immature and mature oligodendrocyte nuclei at DIV3 (K,L) and DIV5 (M,N). Oligodendrocytes from diseased mice, regardless of maturation state, show a dose-dependent increase in nuclear ATXN3 accumulation. (OS) Cell counts of OPCs cultured from Atxn3-KO mice at DIV0 (O), of immature and mature oligodendrocytes at DIV3 (P,Q) and at DIV5 (R,S). Cell counts of immature and mature oligodendrocytes are not different in Atxn3-KO mice compared to WT at all assessed timepoints. Cell counts taken as a percentage of the total DAPI-stained nuclei per field and normalized to WT/WT; Intensity quantifications normalized to averaged WT/WT images (n = 4–8 images per mouse, n = 4–5 mice per genotype). Data presented as mean ± SEM. One-way ANOVA with Tukey’s multiple comparisons test or Student’s t-test were performed: ns = not significant; ** p < 0.01; *** p < 0.001; **** p < 0.0001.
Figure 2
Figure 2
Fewer ubiquitinated proteins are present in SCA3 oligodendrocytes. (A) Representative immunofluorescent images stained for ubiquitinated proteins (red; Ub proteins) and pan-oligodendrocyte marker SOX10 (cyan) in WT/WT, Q84/WT, and Q84/Q84 oligodendrocytes at DIV0 and DIV5. Scale bar: 100 µm; inset scale bar: 12.5 µm (BE) Quantification of DIV0 nuclear and whole-cell ubiquitinated protein intensity in WT and Q84 oligodendrocytes (B,C) and in WT and Atxn3-KO oligodendrocytes (D,E). Nuclear intensity of ubiquitinated proteins at DIV0 is decreased in Q84/Q84 oligodendrocytes, with no changes in whole-cell intensity. Both the nuclear and whole-cell intensities of ubiquitinated proteins are increased at DIV0 in Atxn3-KO oligodendrocytes. (F–I) Quantification of DIV5 nuclear and whole-cell ubiquitinated protein intensity in WT and Q84 oligodendrocytes (F,G) and in WT and Atxn3-KO oligodendrocytes (H,I). At DIV5, the whole-cell intensity of ubiquitinated proteins is decreased in Q84 mice relative to WT while nuclear intensity is unchanged. Atxn3-KO oligodendrocytes at DIV5 show no differences in ubiquitinated protein levels compared to WT cultures. Intensity quantifications normalized to averaged WT/WT images (n = 4–8 images per mouse, n = 2–5 mice per genotype). Data presented as mean ± SEM. One-way ANOVA with Tukey’s multiple comparisons test or Student’s t-test were performed: ns = not significant; * p < 0.05; ** p < 0.01; **** p < 0.0001.
Figure 3
Figure 3
SCA3 oligodendrocytes have no changes in autophagy while the loss of ATXN3 function leads to autophagic dysregulation. (A) Representative immunofluorescent images of p62 in WT/WT, Q84/WT, and Q84/Q84 oligodendrocytes at DIV0 and DIV5. Scale bar: 100 µm. (BE) Quantification of whole-cell p62 expression at DIV0 and DIV5. Whole-cell p62 intensity in Q84 oligodendrocytes remains similar to WT levels at both DIV0 (B) and DIV5 (D), but is increased in Atxn3-KO oligodendrocytes relative to WT at both timepoints (C,E). (F) Representative immunofluorescent images of BECLIN1 in WT/WT, Q84/WT, and Q84/Q84 oligodendrocytes at DIV0 and DIV5. Scale bar: 100 µm. (GJ) Quantification of whole-cell BECLIN1 expression at DIV0 and DIV5. Whole-cell BECLIN1 is unchanged in Q84 oligodendrocytes at both DIV0 (G) and DIV5 (I) and is increased in Atxn3-KO oligodendrocytes relative to WT at both timepoints (H,J). Intensity quantifications normalized to averaged WT/WT images (n = 4–8 images per mouse, n = 3–5 mice per genotype). Data presented as mean ± SEM. One-way ANOVA with Tukey’s multiple comparisons test or Student’s t-test were performed: ns = not significant; * p < 0.05; ** p < 0.01; *** p < 0.001.
Figure 4
Figure 4
DNA damage signaling does not correlate with SCA3 oligodendrocyte maturation impairments, but may increase with cellular stress. (A,B) Representative immunofluorescent images of nuclear DNA damage marker γ-H2AX (white), mature oligodendrocyte marker MBP (red), and pan-oligodendrocyte marker SOX10 (cyan) expression in cultured WT/WT, Q84/WT, and Q84/Q84 oligodendrocytes at DIV0 (A) and DIV5 (B). Scale bar 100 µm, inset scale bar: 12.5 µm. (C,D) Quantification of nuclear γ-H2AX in DIV0 OPCs. Nuclear γ-H2AX intensity at DIV0 is increased in Q84/Q84 oligodendrocytes relative to WT (C) and Atxn3-KO oligodendrocytes relative to WT (D). (EH) Quantification of nuclear γ-H2AX in immature (MBP−/SOX10+) and mature (MBP+) oligodendrocytes at DIV5. Nuclear γ-H2AX intensity is not significantly changed in immature diseased oligodendrocytes (E), nor in Q84/Q84 mature oligodendrocytes relative to WT. Loss of ATXN3 leads to changes in γ-H2AX nuclear expression only in immature oligodendrocytes (G), but not mature cells. Intensity quantifications normalized to averaged WT/WT images (n = 4–8 images per mouse, n = 3–5 mice per genotype). Data presented as mean ± SEM. One-way ANOVA with Tukey’s multiple comparisons test or Student’s t-test were performed: ns = not significant; * p < 0.05; ** p < 0.01; *** p < 0.001.
Figure 5
Figure 5
ATXN3 toxic gain-of-function in SCA3 oligodendrocytes leads to maturation-state dependent changes in the tri-methylation of H3K9, but not H3K27. (A,B) Representative immunofluorescent images of H3K27me3 (magenta), mature oligodendrocyte marker MBP (red), and pan-oligodendrocyte marker SOX10 (cyan) in WT/WT, Q84/WT, and Q84/Q84 oligodendrocytes at DIV0 (A) and DIV5 (B). Scale bar: 100 µm. (C,D) Quantification of nuclear H3K27me3 intensity of DIV0 OPCs show no changes in SCA3 oligodendrocytes (C) or Atxn3-KO oligodendrocytes (D). (EH) Quantification of nuclear H3K27me3 intensity at DIV5 also shows no differences between genotypes in immature (MBP−/SOX10+) or mature (MBP+) oligodendrocytes in diseased (E,F) or Atxn3-KO oligodendrocytes (G,H). (I,J) Representative immunofluorescent images of H3K9me3 (magenta), MBP (red), and SOX10 (cyan) in WT/WT, Q84/WT, and Q84/Q84 oligodendrocytes at DIV0 (I) and DIV5 (J). Scale bar: 100 µm. (K,P) Quantification of nuclear H3K9me3 intensity at DIV0 and DIV5. DIV0 Q84 OPCs have increased nuclear H3K9me3 intensity (K). By DIV5, immature oligodendrocytes (MBP−/SOX10+) show no significant difference (M), but H3K9me3 nuclear intensity in mature Q84/Q84 oligodendrocytes (MBP+) has decreased relative to WT (N). Atxn3-KO oligodendrocytes show no differences of nuclear H3K9me3 intensity in DIV0 OPCs (L), nor in immature or mature oligodendrocytes at DIV5 (O,P). Intensity quantifications normalized to averaged WT/WT images (n = 4–8 images per mouse, n = 2–5 mice per genotype). Data presented as mean ± SEM. One-way ANOVA with Tukey’s multiple comparisons test or Student’s t-test were performed: ns = not significant; * p < 0.05; ** p < 0.01.

Similar articles

Cited by

References

    1. Seidel K., Siswanto S., Brunt E.R.P., Dunnen W.D., Korf H., Rueb U. Brain pathology of spinocerebellar ataxias. Acta Neuropathol. 2012;124:1–21. doi: 10.1007/s00401-012-1000-x. - DOI - PubMed
    1. Rüb U., Schöls L., Paulson H., Auburger G., Kermer P., Jen J.C., Seidel K., Korf H., Deller T. Clinical features, neurogenetics and neuropathology of the polyglutamine spinocerebellar ataxias type 1, 2, 3, 6 and 7. Prog. Neurobiol. 2013;104:38–66. doi: 10.1016/j.pneurobio.2013.01.001. - DOI - PubMed
    1. Paulson H.L., Shakkottai V.G., Clark H.B., Orr H. Polyglutamine spinocerebellar ataxias—From genes to potential treatments. Nat. Rev. Neurosci. 2017;18:613–626. doi: 10.1038/nrn.2017.92. - DOI - PMC - PubMed
    1. Paulson H.L. Dominantly inherited ataxias: Lessons learned from Machado-Joseph disease/spinocerebellar ataxia type 3. Skull Base. 2007;27:133–142. doi: 10.1055/s-2007-971172. - DOI - PubMed
    1. Maciel P., Gaspar C., DeStefano A.L., Silveira I., Coutinho P., Radvany J., Dawson D.M., Sudarsky L., Guimarães J., E Loureiro J. Correlation between CAG repeat length and clinical features in Machado-Joseph disease. Am. J. Hum. Genet. 1995;57:54–61. - PMC - PubMed

Publication types

LinkOut - more resources