. 2022 Aug 10;14(16):3869.
doi: 10.3390/cancers14163869.

Identification of Immune Cell Components in Breast Tissues by a Multiparametric Flow Cytometry Approach

Affiliations

Identification of Immune Cell Components in Breast Tissues by a Multiparametric Flow Cytometry Approach

Luigi Coppola et al. Cancers (Basel). .

Abstract

Immune cell components are able to infiltrate tumor tissues, and different reports described the presence of infiltrating immune cells (TILs) in several types of solid tumors, including breast cancer. The primary immune cell component cells are reported as a lymphocyte population mainly comprising the cytotoxic (CD8+) T cells, with varying proportions of helper (CD4+) T cells and CD19+ B cells, and rarely NK cells. In clinical practice, an expert pathologist commonly detects TILs areas in hematoxylin and eosin (H&E)-stained histological slides via light microscopy. Moreover, other more in-depth approaches could be used to better define the immunological component associated with tumor tissues. Using a multiparametric flow cytometry approach, we have studied the immune cells obtained from breast tumor tissues compared to benign breast pathologies. A detailed evaluation of immune cell components was performed on 15 and 14 biopsies obtained from breast cancer and fibroadenoma subjects, respectively. The percentage of tumor-infiltrating T lymphocytes was significantly higher in breast cancer patients compared to patients with fibroadenoma. Infiltrating helper T lymphocytes were increased in the case of malignant breast lesions, while cytotoxic T lymphocytes disclosed an opposite trend. In addition, our data suggest that the synergistic effect of the presence/activation of NK cells and NKT cells, in line with the data in the literature, determines the dampening of the immune response. Moreover, the lymphocyte-to-monocyte ratio was calculated and was completely altered in patients with breast cancer. Our approach could be a potent prognostic factor to be used in diagnostic/therapeutic purposes for the improvement of breast cancer patients' management.

Keywords: TILs; breast cancer; deep flow cytometry; tumor microenvironment.


Conflict of interest statement

The authors declare no conflict of interest.

Figures

Figure 1
Figure 1
The hematoxylin–eosin staining of three different breast cancer tissue patients with three different level of TILs: absent (left panel), low (middle panel), and moderate (right panel). The inset represents an enlarged detail of the TILs. Magnification 40×. Scale bars 50 µm.
Figure 2
Figure 2
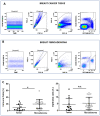
Panel (A) and (B) show the flow cytometry gating strategy to discriminate between lymphoid (CD45pos/EpCAMneg) and epithelial (CD45neg/EpCAMneg) cells. The CD45 vs. time dot plot was examined to evaluate the absence of electronic noise during the acquisition; the FSC-A vs. FSC-H plot to exclude doublets; and then the physical parameters FSC-A vs. SSC-A to select live cells and exclude debris. Panel (C) shows the median percentage of immune and epithelial cells in both the breast tumor and fibroadenoma samples. * = p-value < 0.05 unpaired t-test. n.s. = not significative.
Figure 3
Figure 3
T-lymphocyte subtypes gating strategy. After doublet exclusion (B), the immune cells (A) were selected as a CD45+ event (C). From the CD45+ cells, we selected the T-lymphocytes as CD45pos/CD3pos and B-lymphocytes as CD45pos/CD19pos (D). Inside the T-lymphocytes we determine the CD8+ T-lymphocytes and CD4+ T-lymphocytes (E), which were also assessed for their level of activation by determining the expression levels of HLA-DR (F,G).
Figure 4
Figure 4
T-lymphocyte subset percentages were plotted, according to specific membrane receptor, in tumor (black dots) and fibroadenoma (white dots) tissue patients. (A) CD3pos T-lymphocytes. (B) CD3pos/CD4pos T-lymphocytes. (C) CD3pos/CD8pos T-lymphocytes. (D) CD4pos-CD8pos ratio. (E) CD4pos/HLA-DRpos T-lymphocytes. (F) CD8pos/HLA-DRpos T-lymphocytes. The median and standard deviation are reported. * = p-value < 0.05, ** = p-value < 0.01, and **** = p-value < 0.0001; unpaired t-tests. n.s. = not significant.
Figure 5
Figure 5
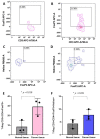
Identification of the regulatory T cells by flow cytometry. Panel (A) and (B) show the identification of T-Regs as CD45+/CD3+/CD4+/FoxP3+ events in normal and cancer tissues, respectively. Panel (C) and (D) show the T-Reg identification including the Helios markers in normal and cancer tissues, respectively. Histograms show the mean plus standard deviation of the percentage of FoxP3+ T-reg (E) and FoxP3+/Helios+ T-reg (F). T-Reg identified with the FoxP3 marker presented a mean of 8.4% (SD = 6.2%) and 29.19% (SD = 8.4%) in normal versus cancer breast tissues, respectively (E). The addition, the Helios marker revealed a T-Reg mean of 4.35% (SD = 1.7%) and 7.75% (SD = 1.9%) in normal versus cancer breast tissues, respectively (F). * = p-value < 0.05 unpaired t-test.
Figure 6
Figure 6
NK subtypes gating strategy. NK cells were selected starting from the CD45pos event as CD45pos/CD16dim cells (A). Inside the NK cells, we selected the cytotoxic NK cells (CD56pos/CD16pos, (B) and NK-T cells (CD56pos/CD3pos, (C). The NK-T type I cells were selected as CD56pos/CD3pos/CD4pos (D). Both NK and NK-T cells were also assessed for their level of activation by determining the expression levels of HLA-DR (E) and (F).
Figure 7
Figure 7
NK cell subset percentages were plotted according to the specific membrane receptor, in tumor (black dots) and fibroadenoma (white dots) tissue patients. (A) CD56pos NK cells. (B) CD56pos/CD16pos cytotoxic NK cells. (C) CD56pos/CD3pos NK-T cells. (D) CD56pos/CD3pos/CD4pos NK cells (NK Type I). (E) CD56pos/HLA-DRpos NK cells. (F) CD56pos/CD3pos/HLA-DRpos NK cells. The median and standard deviation are reported. * = p-value < 0.05, ** = p-value < 0.01, and *** = p-value < 0.001; unpaired t-tests. n.s. = not significant.
Figure 8
Figure 8
Monocyte subtype gating strategy. Inside the CD45pos cells, we selected monocytes as CD14pos events and atypical monocytes (CD14pos/CD16pos) (A). Monocytes were also assessed for their level of activation by determining the expression levels of HLA-DR (B).
Figure 9
Figure 9
Monocyte subset percentages were plotted according to the specific membrane receptors, in tumor (black dots) and fibroadenoma (white dots) tissue patients. (A) Lymphocytes-to-monocytes ratio. (B) CD14pos monocytes. (C) CD14pos/CD16pos atypical monocytes. (D) CD14pos/HLA-DRpos monocytes. The median and standard deviation are reported. * = p-value < 0.05 and ** = p-value < 0.01; and unpaired t-tests. n.s. = not significant.

References

    1. Sung H., Ferlay J., Siegel R.L., Laversanne M., Soerjomataram I., Jemal A., Bray F. Global Cancer Statistics 2020: GLOBOCAN Estimates of Incidence and Mortality Worldwide for 36 Cancers in 185 Countries . CA Cancer J. Clin. 2021;71:209–249. doi: 10.3322/caac.21660. - DOI - PubMed
    1. Mehraj U., Dar A.H., Wani N.A., Mir M.A. Tumor Microenvironment Promotes Breast Cancer Chemoresistance. Cancer Chemother. Pharmacol. 2021;87:147–158. doi: 10.1007/s00280-020-04222-w. - DOI - PubMed
    1. Pagès F., Kirilovsky A., Mlecnik B., Asslaber M., Tosolini M., Bindea G., Lagorce C., Wind P., Marliot F., Bruneval P., et al. In Situ Cytotoxic and Memory T Cells Predict Outcome in Patients With Early-Stage Colorectal Cancer. J. Clin. Oncol. 2009;27:5944–5951. doi: 10.1200/JCO.2008.19.6147. - DOI - PubMed
    1. Dieu-Nosjean M.-C., Antoine M., Danel C., Heudes D., Wislez M., Poulot V., Rabbe N., Laurans L., Tartour E., de Chaisemartin L., et al. Long-Term Survival for Patients With Non–Small-Cell Lung Cancer With Intratumoral Lymphoid Structures. J. Clin. Oncol. 2008;26:4410–4417. doi: 10.1200/JCO.2007.15.0284. - DOI - PubMed
    1. Denkert C., Loibl S., Noske A., Roller M., Müller B.M., Komor M., Budczies J., Darb-Esfahani S., Kronenwett R., Hanusch C., et al. Tumor-Associated Lymphocytes as an Independent Predictor of Response to Neoadjuvant Chemotherapy in Breast Cancer. J. Clin. Oncol. Off. J. Am. Soc. Clin. Oncol. 2010;28:105–113. doi: 10.1200/JCO.2009.23.7370. - DOI - PubMed