

Physiological Cell Culture Media Tune Mitochondrial Bioenergetics and Drug Sensitivity in Cancer Cell Models
- PMID: 36010911
- PMCID: PMC9405899
- DOI: 10.3390/cancers14163917
Physiological Cell Culture Media Tune Mitochondrial Bioenergetics and Drug Sensitivity in Cancer Cell Models
Abstract
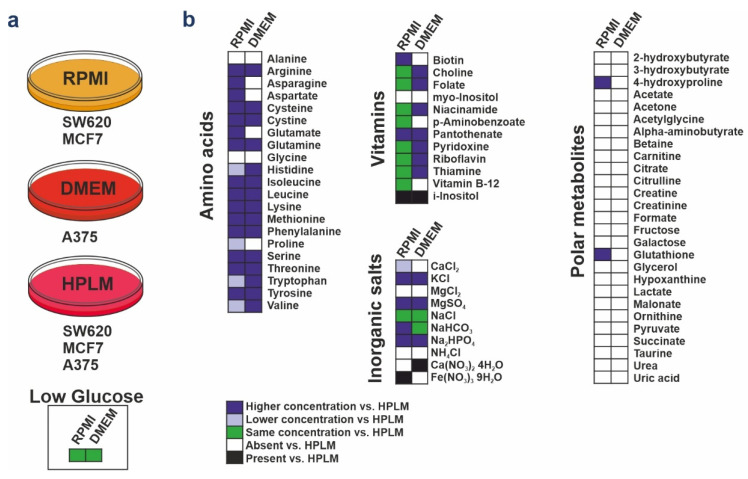
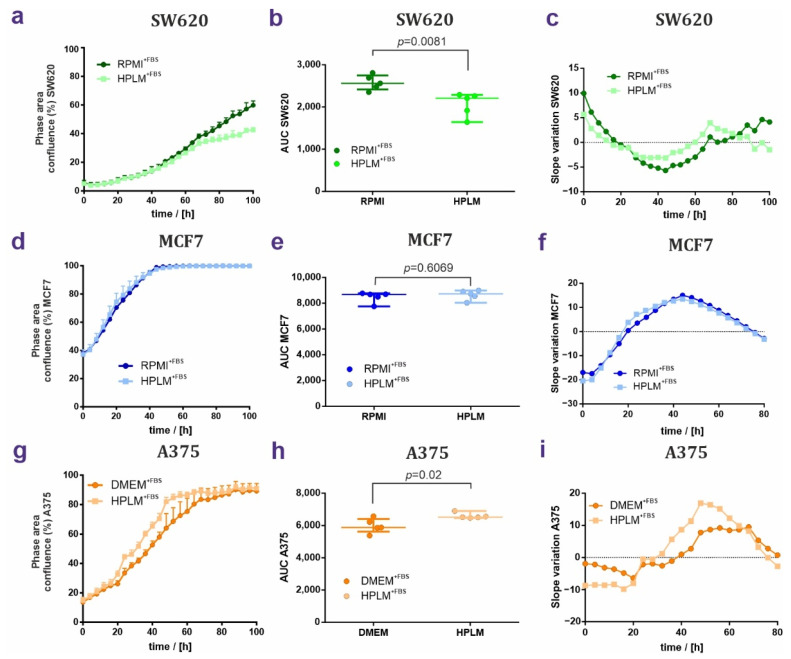
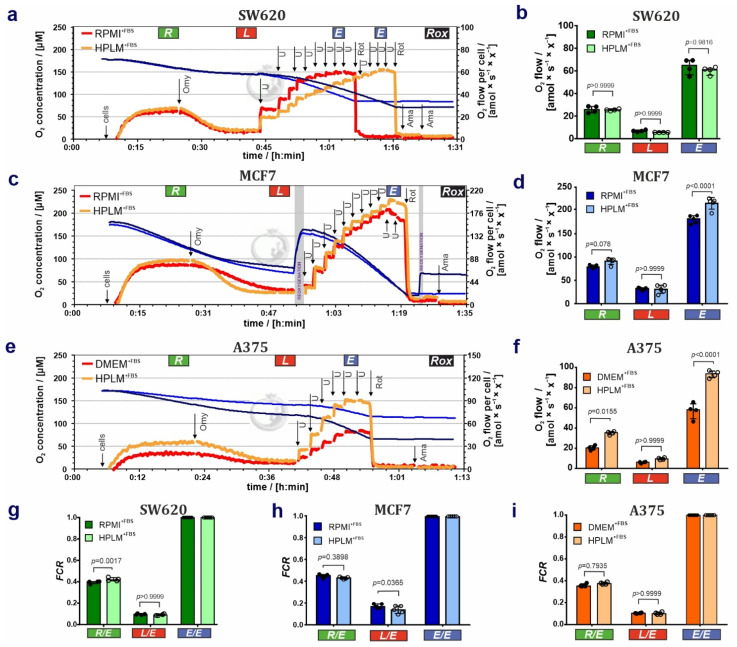
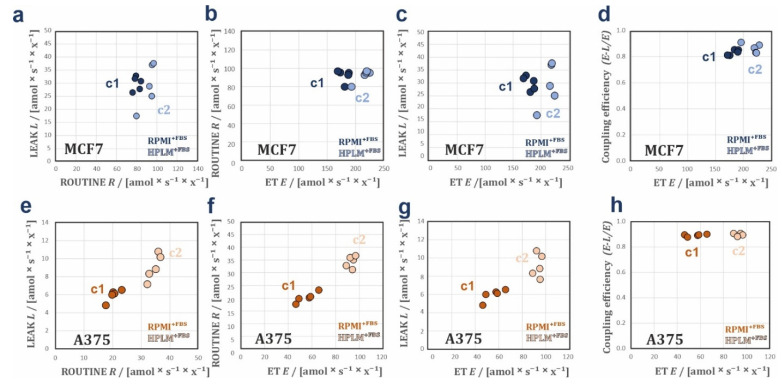
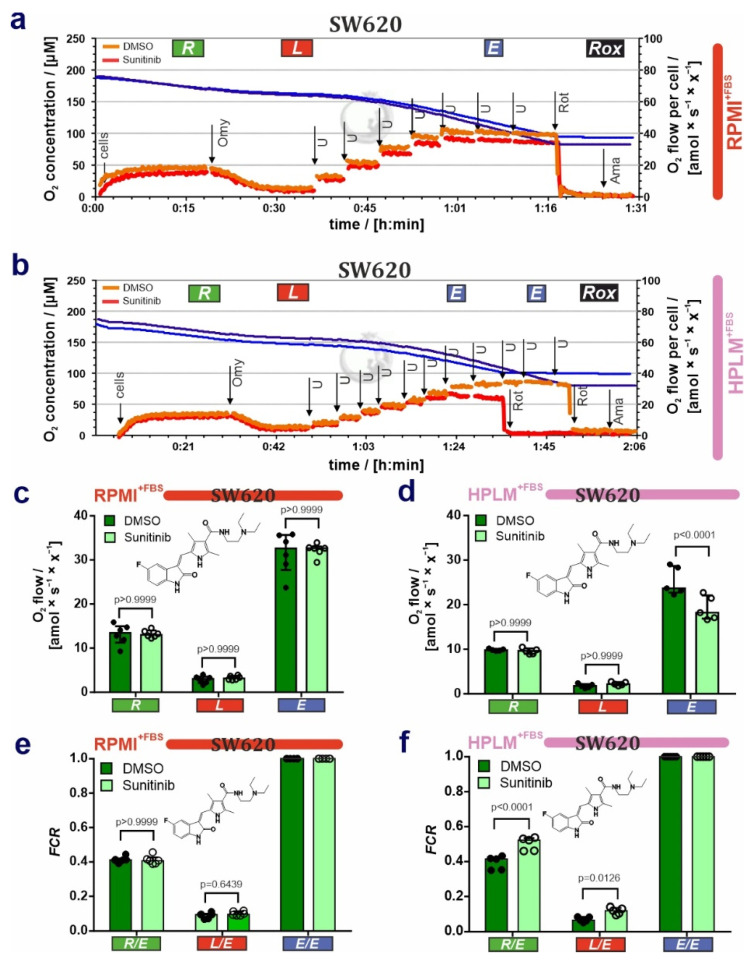
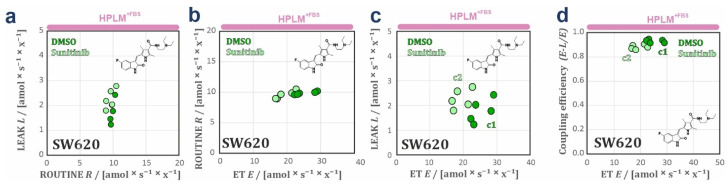
Two-dimensional cell cultures are established models in research for studying and perturbing cell-type specific functions. However, many limitations apply to the cell growth in a monolayer using standard cell culture media. Although they have been used for decades, their formulations do not mimic the composition of the human cell environment. In this study, we analyzed the impact of a newly formulated human plasma-like media (HPLM) on cell proliferation, mitochondrial bioenergetics, and alterations of drug efficacies using three distinct cancer cell lines. Using high-resolution respirometry, we observed that cells grown in HPLM displayed significantly altered mitochondrial bioenergetic profiles, particularly related to mitochondrial density and mild uncoupling of respiration. Furthermore, in contrast to standard media, the growth of cells in HPLM unveiled mitochondrial dysfunction upon exposure to the FDA-approved kinase inhibitor sunitinib. This seemingly context-dependent side effect of this drug highlights that the selection of the cell culture medium influences the assessment of cancer drug sensitivities. Thus, we suggest to prioritize media with a more physiological composition for analyzing bioenergetic profiles and to take it into account for assigning drug efficacies in the cell culture model of choice.
Keywords: cancer cells; cell bioenergetics; cell culture media; cell proliferation; kinase inhibitor; mitochondrial function.
Conflict of interest statement
The authors declare no conflict of interest.
Figures
Similar articles
-
Impact of physiological media on acute myeloid leukemia bioenergetics and cell proliferation.Cancer Metab. 2025 May 26;13(1):25. doi: 10.1186/s40170-025-00395-1. Cancer Metab. 2025. PMID: 40420205 Free PMC article.
-
Media composition and O2 levels determine effects of 17β-estradiol and selective estrogen receptor modulators on mitochondrial bioenergetics and cellular reactive oxygen species.Am J Physiol Cell Physiol. 2021 Jul 1;321(1):C72-C81. doi: 10.1152/ajpcell.00080.2021. Epub 2021 May 19. Am J Physiol Cell Physiol. 2021. PMID: 34010067
-
The Effect of Oxygen and Micronutrient Composition of Cell Growth Media on Cancer Cell Bioenergetics and Mitochondrial Networks.Biomolecules. 2021 Aug 9;11(8):1177. doi: 10.3390/biom11081177. Biomolecules. 2021. PMID: 34439843 Free PMC article.
-
Utilization of Human Samples for Assessment of Mitochondrial Bioenergetics: Gold Standards, Limitations, and Future Perspectives.Life (Basel). 2021 Sep 10;11(9):949. doi: 10.3390/life11090949. Life (Basel). 2021. PMID: 34575097 Free PMC article. Review.
-
Culture media for propagation of mammalian cells, viruses, and other biologicals.Adv Biotechnol Processes. 1985;5:1-30. Adv Biotechnol Processes. 1985. PMID: 2417609 Review.
Cited by
-
Impact of physiological media on acute myeloid leukemia bioenergetics and cell proliferation.Cancer Metab. 2025 May 26;13(1):25. doi: 10.1186/s40170-025-00395-1. Cancer Metab. 2025. PMID: 40420205 Free PMC article.
-
Beyond glucose and Warburg: finding the sweet spot in cancer metabolism models.NPJ Metab Health Dis. 2024 Sep 2;2(1):11. doi: 10.1038/s44324-024-00017-2. NPJ Metab Health Dis. 2024. PMID: 40603611 Free PMC article. Review.
-
Energy Metabolism Behavior and Response to Microenvironmental Factors of the Experimental Cancer Cell Models Differ from that of Actual Human Tumors.Mini Rev Med Chem. 2025;25(4):319-339. doi: 10.2174/0113895575322436240924101642. Mini Rev Med Chem. 2025. PMID: 39411957 Review.
-
The utility of 3D models to study cholesterol in cancer: Insights and future perspectives.Front Oncol. 2023 Apr 3;13:1156246. doi: 10.3389/fonc.2023.1156246. eCollection 2023. Front Oncol. 2023. PMID: 37077827 Free PMC article. Review.
-
Drug screening in human physiologic medium identifies uric acid as an inhibitor of rigosertib efficacy.JCI Insight. 2024 May 30;9(13):e174329. doi: 10.1172/jci.insight.174329. JCI Insight. 2024. PMID: 38815134 Free PMC article.
References
Grants and funding
LinkOut - more resources
Full Text Sources
