. 2022 Aug 16;14(16):3947.
doi: 10.3390/cancers14163947.

Targeting MDM4 as a Novel Therapeutic Approach in Prostate Cancer Independent of p53 Status

Affiliations

Targeting MDM4 as a Novel Therapeutic Approach in Prostate Cancer Independent of p53 Status

Javier Octavio Mejía-Hernández et al. Cancers (Basel). .

Abstract

Metastatic prostate cancer is a lethal disease in patients incapable of responding to therapeutic interventions. Invasive prostate cancer spread is caused by failure of the normal anti-cancer defense systems that are controlled by the tumour suppressor protein, p53. Upon mutation, p53 malfunctions. Therapeutic strategies to directly re-empower the growth-restrictive capacities of p53 in cancers have largely been unsuccessful, frequently because of a failure to discriminate responses in diseased and healthy tissues. Our studies sought alternative prostate cancer drivers, intending to uncover new treatment targets. We discovered the oncogenic potency of MDM4 in prostate cancer cells, both in the presence and absence of p53 and also its mutation. We uncovered that sustained depletion of MDM4 is growth inhibitory in prostate cancer cells, involving either apoptosis or senescence, depending on the cell and genetic context. We identified that the potency of MDM4 targeting could be potentiated in prostate cancers with mutant p53 through the addition of a first-in-class small molecule drug that was selected as a p53 reactivator and has the capacity to elevate oxidative stress in cancer cells to drive their death.

Keywords: APR-246; MDM4; MDMX; TP53; XI-011; eprenetapopt; mutant p53; p53; prostate cancer.


Conflict of interest statement

The authors declare no conflict of interest.

Figures
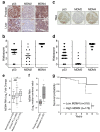
Figure 1
Figure 1
MDM4 is highly expressed in primary and metastatic prostate cancer and is associated with poor clinical outcome. (a,b) Primary and metastatic tumour samples were collected from autopsied PC patients (n = 5) and stained with antibodies against p53, MDM2, and MDM4. (b) Graph showing the staining intensity and the proportion of cells stained (histoscore) of metastatic samples (n = 12, see Supplementary Table S1). (c,d) TMA of a second cohort of primary PC samples (n = 120) [Gleason grade 6–9 and tumour stage T2–T4]. Likewise, TMAs were stained for p53, MDM2, and MDM4. (d) Graph shows TMAs histoscore. Histoscores were calculated as described in Materials and Methods. Scale bars are equivalent to 100 µm. Data is shown as mean ± SEM. (e) TCGA analysis of MDM4 mRNA expression levels in PC that retain either wt or mutant p53 compared to normal prostate tissue. (f) Oncomine dataset analysis of MDM4 mRNA expression levels in primary and metastatic PC. Data is shown as mean ± SD. Statistical significance was calculated using ANOVA and Tukey’s tests. (g) Kaplan–Meier plot for PC patients expressing either low or high MDM4 mRNA levels as a function of survival probability. Statistical significance was calculated using a Log-rank (Mantel–Cox) test. Statistical significance is shown as * p ≤ 0.05, *** p ≤ 0.001.
Figure 2
Figure 2
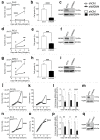
MDM4 knock down impeded the in vitro proliferation of prostate cancer cell lines that are p53 wild-type, null and mutant. Five PC cell lines of distinct p53 status were transduced with inducible shRNA to generate either MDM4 knock down (shMDM4) or counterpart controls (shCtrl). Expression of the shRNAs was induced with Doxycycline (Doxy; 25 ng/mL). (a,d,g) The effects on cell numbers in response to Doxycycline treatment were determined for each PC cell line up to day 7. (b,e,h) Cell growth assessed by SRB assay was calculated as a proportion of the control groups on day 5. Changes in (j,n) cell numbers and (k,o) confluence upon shRNA expression were determined for two mutant p53 expressing lines using the Incucyte® system up to day 7. (c,f,i,m,q) MDM4 protein levels were analysed by Western blot on day 5. (l,p) MDM4 mRNA levels were analysed by RT-qPCR for two mutant p53 lines on days 3, 4 and 5. MDM4 levels were normalised to the housekeeping gene hRLP37a and expressed relative to shCtrl. Data are shown as mean ± SEM (n = 3–6). Statistical significance was calculated using a two-tailed Student’s t-test (* p ≤ 0.05, ** p ≤ 0.01, *** p ≤ 0.001, **** p ≤ 0.0001). The Raw Western blot data is shown in Figure S8.
Figure 3
Figure 3
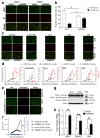
MDM4 inhibition causes apoptosis independently of PARP-1 cleavage and caspase 3/caspase 7 activation in the DU145 prostate cancer cell line in vitro. (a) shRNA expression was induced with Doxycyline (Doxy; 25 ng/mL) in mutant p53 and GPF-tagged DU145 cells. Cells were stained with propidium iodide (PI) on day 5 and 6. Representative fluorescence microscopy images of DU145 are shown. (b) Flow cytometry analysis of the proportion of live/dead DU145 cells using TO-PRO-3 following MDM4 KD in response to 5 days of Doxycycline exposure. (c,d) After the initial Doxycycline treatment (day 1) for shRNA induction, z-VAD-FMK (25 μM), Fer-1 (10 µM), NAC (2.5 mM), and CPX (0.5 µM) were added on day 4 (indicated by the blue arrow). PI was added on day 5 (indicated by the red arrow) and was used to unveil cell death (with PI counts plotted in red). The live-cell imaging Incucyte® system was used to track the effects on the cell growth and cell death kinetics of z-VAD-FMK, Fer-1, NAC, and CPX, following MDM4 inhibition. (c) Representative fluorescence microscopy images. (e,f) The SKBr3 (GFP tagged) cell line was treated with 20 µM of doxorubicin and used as an apoptosis-positive control (see Western blot in Figure S9). shRNA expression was induced with Doxycycline (25 ng/mL) in DU145 for 7 days. On day 2, cells were treated with Red Incucyte® Caspase-3/7 Dye for detecting apoptosis. (e) Representative fluorescence microscopy images. (f) Cell growth rate and kinetic activation of caspase 3/7 were monitored using the live-cell imaging Incucyte® system. (g) Following MDM4 inhibition, protein was extracted on day 5 for exploring the activation of caspase 3 and PARP-1 by Western blot. Each column corresponds to a biological replicate. (h) DU145 was treated with Doxycycline and collected on day 5 for RNA extraction. BBC3 (PUMA), PMAIP1 (NOXA), and BAX mRNA levels were analysed by RT-qPCR; the graph depict the mRNA fold change levels normalised to the housekeeping gene hRLP37a and expressed relative to shCtrl. In representative fluorescence microscopy images, scale bars indicate 100 μm. Data are shown as mean ± SEM (n = 3–6). Statistical significance was calculated using a two-tailed Student’s t-test (* p ≤ 0.05, ** p ≤ 0.01, *** p ≤ 0.001, **** p ≤ 0.0001). The Raw Western blot data is shown in Figure S10.
Figure 4
Figure 4
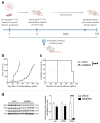
MDM4 expression is necessary for the in vivo growth of prostate cancer cells with mutant p53. DU145 mutant p53 PC cell line transduced with either Doxycycline-inducible shMDM4 or shCtrl was subcutaneously injected into the contra-lateral flanks of 6–8 weeks old male NOD SCID gamma IL2R-gamma chain (NSG) mice (n = 6 per treatment cohort). (a) DU145 cells were pre-treated in vitro with Doxycycline (25 ng/mL) for 24 h before injection into the mice. Doxycycline was supplemented in the drinking water (2.0 mg/L) until ethical endpoint and subsequent sacrifice. (b) Tumour volume and (c) survival percentage were measured. Statistical significance shown as result of Log-rank (Mantel–Cox) test. (*** p ≤ 0.001, **** p ≤ 0.0001). When the ethical endpoint was reached (∼1500 mm3), tumours were collected, and protein was extracted. (d) p53, MDM2 and MDM4 protein levels were analysed by Western blot. Each column in the Western blot corresponds to a biological replicate. The graph shows the Western blot’s densitometric analysis; protein levels were normalised to β-actin and expressed relative to shCtrl. Data are shown as mean ± SEM of biological replicates. Statistical significance was calculated using a two-tailed Student’s t-test (*** p ≤ 0.001, **** p ≤ 0.0001). The Raw Western blot data is shown in Figure S11.
Figure 5
Figure 5
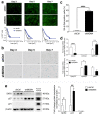
Following MDM4 inhibition, PC-3 (p53R273H) prostate cancer cell line undergoes cellular senescence in vitro, in a process strongly associated with the SKP2/p27 pathway. Either shMDM4 or shCtrl expression was induced with Doxycycline (Doxy; 25 ng/mL) in GPF-tagged (GFP+) PC-3 (p53R273H). (a) High-resolution fluorescence photos were taken using the Incucyte® system on days 3, 5, and 7 to explore cell morphology changes upon MDM4 KD. Images were analysed using the Incucyte® Live-Cell Analysis System and the Cell-by-Cell Analysis Software Module. Histograms comparing the distribution frequency of the fluorescent area (μm2) of all cells plated at a given time point (either day 3, 5 or 7). The software automatically determined the histogram bins. Data are shown as a percentage of GFP+ cells. (b) Senescence-associated β-galactosidase (SA-β-gal) staining at pH 6 of the PC-3 (p53R273H) cell line on day 3, day 5 and day 7 after induction of either shMDM4 or shCtrl expression with Doxycycline. SA-β-gal-positive cells stained blue. Scale bars indicate 100 μm. (c) Graph shows the percentage of senescent cells relative to the total number of cells (per image) on day 7 of three biological replicates. (d) PC-3 (p53R273H) cells were collected after 5-day treatment with Doxycycline for RNA and protein analyses, respectively. Senescence-related genes CCNA2 (Cyclin A2), CDKN2A (p16), SERPINE1 (PAI-1), CDKN1A (p21), CDKN1B (p27), and SKP2 (SKP2) mRNA levels were analysed by RT-qPCR. mRNA expression levels were normalised to the housekeeping gene hRLP37a and expressed relative to shCtrl. (e) Protein levels of p21, p27 and SKP2 were determined by Western blot. Each column corresponds to a biological replicate. The graph shows the Western blot densitometric analysis of p21, p27 and SKP2 protein levels normalised to β-actin and expressed relative to shCtrl. In all cases, data are shown as mean ± SEM of biological replicates (n = 3–6). Statistical significance was calculated using a two-tailed Student’s t-test (* p ≤ 0.05, ** p ≤ 0.01, **** p ≤ 0.0001). The Raw Western blot data is shown in Figure S12.
Figure 6
Figure 6
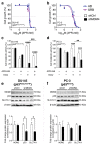
Combination therapy: MDM4 inhibition and eprenetapopt (APR-246) attenuate the cell growth of mutant p53 expressing PC cell lines in vitro. (a,b) PC cell lines DU145 (p53p223L/V274F) and PC-3 (p53R273H) were treated in vitro with APR-246 (eprenetapopt) at concentrations ranging from 0 µM to 60 µM for a period of five days prior to assessment. APR-246 dose–response was evaluated by assessing the suppression of cell growth using Alamar blue (AB) and sulforhodamine B (SRB) assays. (c,d) To examine whether APR-246 increases the efficacy of MDM4 inhibition, PC cell lines were treated either with IC30 of APR-246 alone or in combination with Doxycycline (Doxy 25 ng/mL) over a period of 5 days. Treatment response was evaluated by assessing the suppression of cell growth using Alamar blue assay. (e,f) shRNA expression was induced with Doxycycline (25 ng/mL) in mutant p53 PC cells. Cells were collected on day 5 for protein expression analyses. Protein levels of MDM2, p53, and SLC7A11 were determined by Western blot. Each column corresponds to a biological replicate. The graphs show the Western blot densitometric analysis of MDM2, p53, and SLC7A11 protein levels normalised to β-actin and expressed relative to shCtrl. Data are shown as the mean ± SEM of biological replicates (n = 3–6). Statistical significance was calculated using a two-tailed Student’s t-test (* p ≤ 0.05, ** p ≤ 0.01, *** p ≤ 0.001, **** p ≤ 0.0001). The Raw Western blot data is shown in Figure S13.
Figure 7
Figure 7
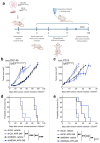
Testing the therapeutic potential of MDM4 KD in combination with eprenetapopt (APR-246) in PC xenografts that express mutant p53 in vivo. (a) NSG male mice between 6–8 weeks were injected subcutaneously with either DU145 (p53p223L/V274F) or PC-3 (p53R273H) PC cells into their contra-lateral flanks. When tumour growth reached ≥ 150 mm3 (day 0), MDM4 KD was induced by Doxycyline supplementation in the drinking water (2.0 mg/L) until the ethical endpoint was reached (∼1500 mm3). APR-246 was given to mice as a 200 mg/Kg intraperitoneal injection (100 mg/Kg twice a day) for 14 days. (b) Tumour volume and (c) survival percentage were measured. n = 6, per treatment cohort. (d,e) Statistical significance shown as result of Log-rank (Mantel–Cox) test. (** p ≤ 0.01, *** p ≤ 0.001).

References

    1. Sandhu S., Moore C.M., Chiong E., Beltran H., Bristow R.G., Williams S.G. Prostate cancer. Lancet. 2021;398:1075–1090. doi: 10.1016/S0140-6736(21)00950-8. - DOI - PubMed
    1. Risdon E.N., Chau C.H., Price D.K., Sartor O., Figg W.D. PARP Inhibitors and Prostate Cancer: To Infinity and Beyond BRCA. Oncologist. 2021;26:e115–e129. doi: 10.1634/theoncologist.2020-0697. - DOI - PMC - PubMed
    1. Lang G.A., Iwakuma T., Suh Y.A., Liu G., Rao V.A., Parant J.M., Valentin-Vega Y.A., Terzian T., Caldwell L.C., Strong L.C., et al. Gain of function of a p53 hot spot mutation in a mouse model of Li-Fraumeni syndrome. Cell. 2004;119:861–872. doi: 10.1016/j.cell.2004.11.006. - DOI - PubMed
    1. Olive K.P., Tuveson D.A., Ruhe Z.C., Yin B., Willis N.A., Bronson R.T., Crowley D., Jacks T. Mutant p53 gain of function in two mouse models of Li-Fraumeni syndrome. Cell. 2004;119:847–860. doi: 10.1016/j.cell.2004.11.004. - DOI - PubMed
    1. Powell E., Piwnica-Worms D., Piwnica-Worms H. Contribution of p53 to metastasis. Cancer Discov. 2014;4:405–414. doi: 10.1158/2159-8290.CD-13-0136. - DOI - PMC - PubMed