Review
. 2022 Aug 18;14(16):3997.
doi: 10.3390/cancers14163997.

Current Imaging Diagnosis of Hepatocellular Carcinoma

Affiliations
Review

Current Imaging Diagnosis of Hepatocellular Carcinoma

Evangelos Chartampilas et al. Cancers (Basel). .

Abstract

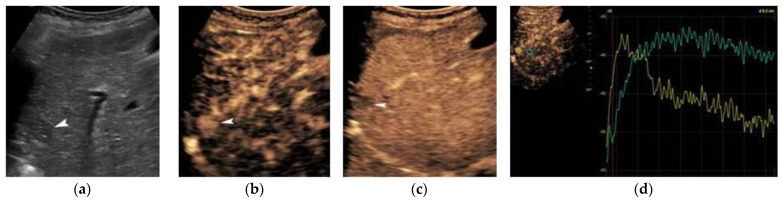
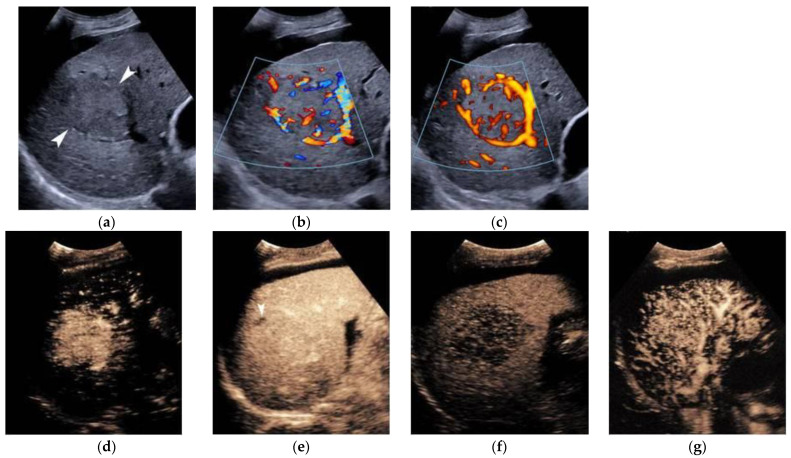
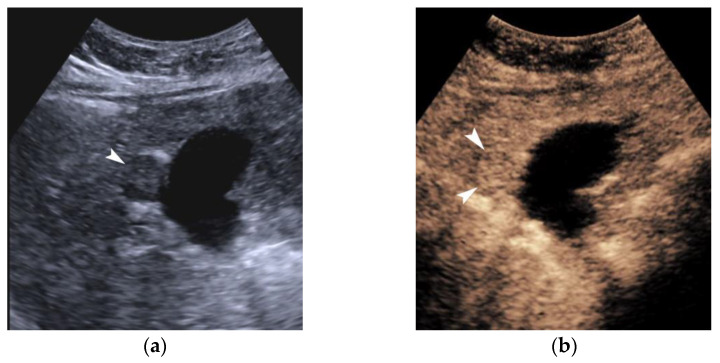
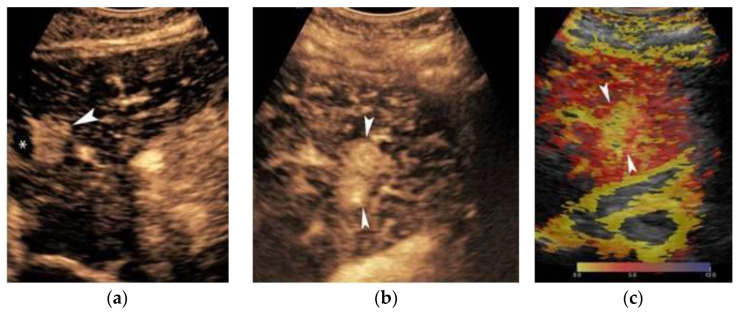
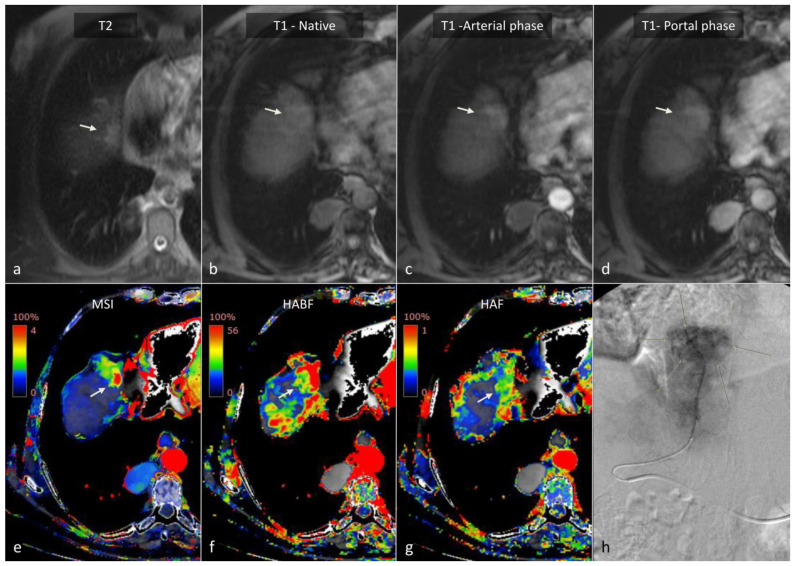
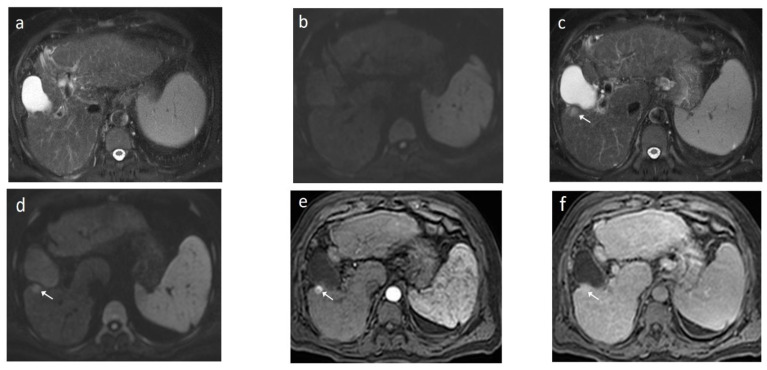
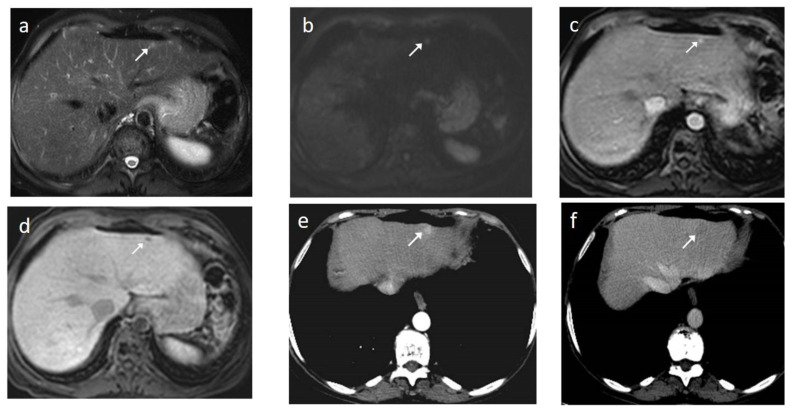
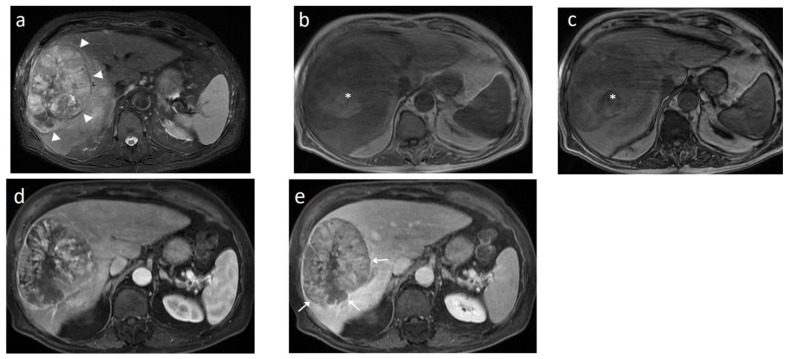
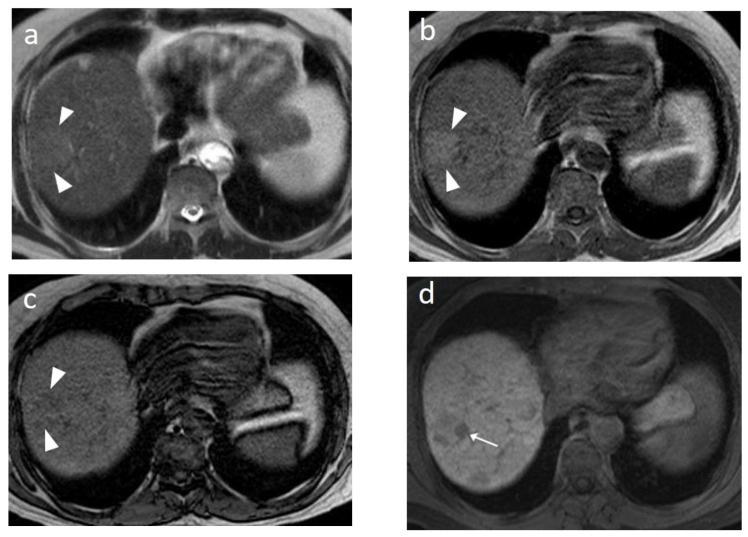
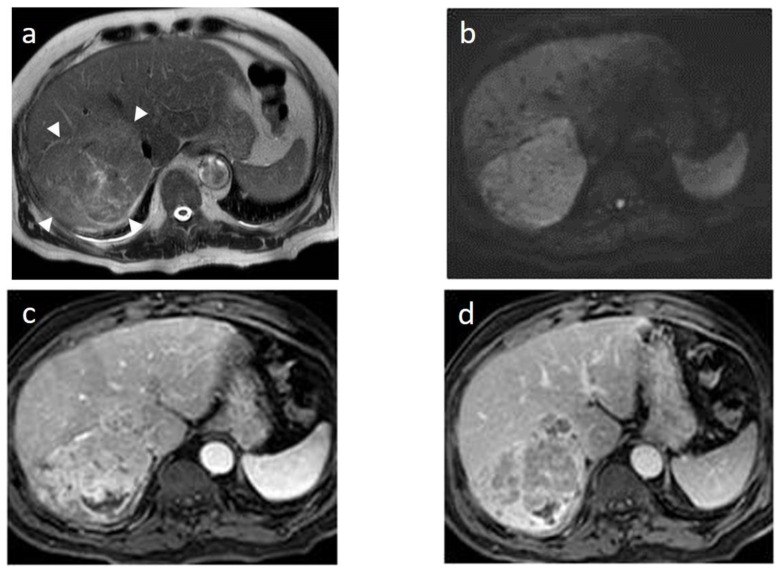
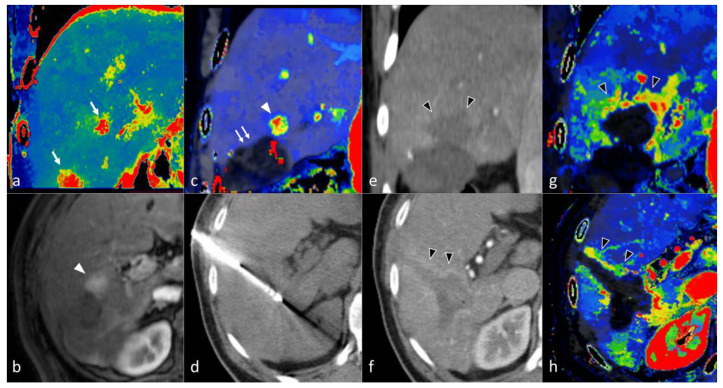
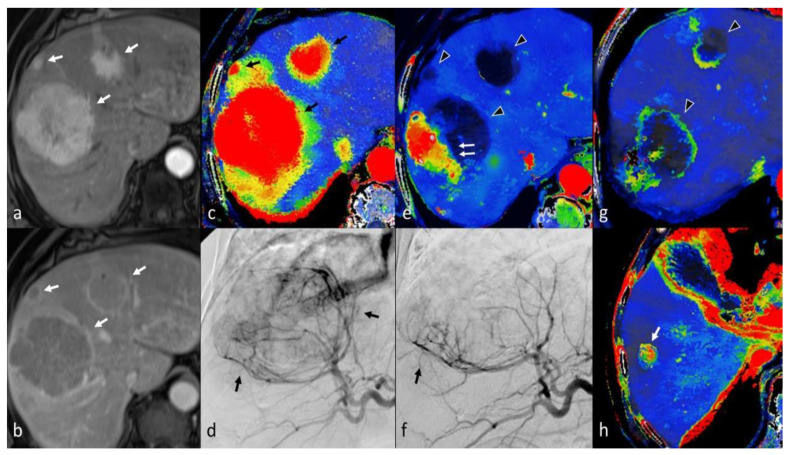
Hepatocellular carcinoma (HCC) is the fourth leading cause of cancer related death worldwide. Radiology has traditionally played a central role in HCC management, ranging from screening of high-risk patients to non-invasive diagnosis, as well as the evaluation of treatment response and post-treatment follow-up. From liver ultrasonography with or without contrast to dynamic multiple phased CT and dynamic MRI with diffusion protocols, great progress has been achieved in the last decade. Throughout the last few years, pathological, biological, genetic, and immune-chemical analyses have revealed several tumoral subtypes with diverse biological behavior, highlighting the need for the re-evaluation of established radiological methods. Considering these changes, novel methods that provide functional and quantitative parameters in addition to morphological information are increasingly incorporated into modern diagnostic protocols for HCC. In this way, differential diagnosis became even more challenging throughout the last few years. Use of liver specific contrast agents, as well as CT/MRI perfusion techniques, seem to not only allow earlier detection and more accurate characterization of HCC lesions, but also make it possible to predict response to treatment and survival. Nevertheless, several limitations and technical considerations still exist. This review will describe and discuss all these imaging modalities and their advances in the imaging of HCC lesions in cirrhotic and non-cirrhotic livers. Sensitivity and specificity rates, method limitations, and technical considerations will be discussed.

Keywords: MR diffusion imaging; computed tomography (CT); contrast-enhanced ultrasound (CEUS); diagnostic algorithms; hepatocellular carcinoma (HCC); locoregional treatment; magnetic resonance imaging (MRI); multiparametric imaging; perfusion imaging; ultrasound (US).


Conflict of interest statement

The authors declare no conflict of interest.

Figures

Figure 1
Figure 1
Typical CEUS findings of HCC nodule. B-mode (a) showing a hypo-echoic nodule (arrowhead) inside a heterogeneous cirrhotic liver. Arterial (b) and portal-venous phase (c) CEUS image showing homogeneous arterial phase hyperenhancement and mild wash-out, respectively, in keeping with HCC (arrowhead). Time-Intensity-Curve analysis (d) confirming the earlier enhancement of the nodule on arterial phase and wash-out. Quantitative parameters can be extracted using this type of analysis.
Figure 2
Figure 2
CEUS findings of a large HCC. B-mode (a) showing an ill-defined mildly hypo-echoic mass (outlined by arrowheads) inside the right lobe of a cirrhotic liver complicated with ascites. Colour (b) and power (c) Doppler technique visualizing the irregular internal vascular pattern of the mass. Note the increased vascularity locally. Arterial (d), venous (e), and delayed (f) CEUS image showing arterial phase hyperenhancement prior to adjacent hepatic parenchyma, iso-enhancement on portal-venous phase, and wash-out on the delayed phase (approximately 3 min). Note the area of necrosis appearing as non-enhancing (arrowhead on (e)). Temporal MIP image (g) showing the vascular architecture of the mass. Note the dense and irregular vascularity indicated inside the lesion.
Figure 3
Figure 3
A regenerative nodule in liver cirrhosis. B-mode (a) depicted a rounded hypo-echoic nodule (arrowhead) with smooth border. CEUS (b) showed that the nodule (outlined by the arrowheads) demonstrated enhancement identical to the adjacent parenchyma with no arterial phase hyperenhancement or wash-out. These findings are in keeping with a regenerative nodule.
Figure 4
Figure 4
CEUS temporal MIP and parametric image in HCC. Sagittal arterial-phase CEUS image (a) showing an HCC nodule (arrowhead) developing next to a previous area of ablation (asterisk). Axial temporal MIP image (b) delineating the entire HCC nodule (outlined by arrowheads). Parametric colour map (c) confirming the earlier and homogeneous arrival of contrast in the HCC nodule.
Figure 5
Figure 5
Typical hallmark imaging features of HCC in a 60-year-old patient with HBV cirrhosis. (a) Late arterial phase, (b) Portal-venous phase, and (c) Delayed phase. MDCT images show a 30-mm mass in the left liver lobe with global APHE (arrows) (a) “wash-out” on the PVP (arrow) (b), and capsule appearance on both the PVP and delayed phase (arrow) (b,c). Note the enhancement of both the left hepatic artery and portal vein with no enhancement of the hepatic veins on the late arterial phase (arrowheads) (a) and enhancement of the left hepatic artery, portal vein, and hepatic veins on PVP (arrowheads) (b).
Figure 6
Figure 6
Ancillary imaging features for HCC assessment. Nodule-in-nodule architecture, mosaic architecture, and corona enhancement on the late arterial and portal-venous phase, respectively. MDCT axial images. (a,b): A small nodule (arrowhead) is located at the periphery inside a larger nodule (arrow), with APHE (a) and “wash-out” (b) on PVP. The parent nodule is not enhancing. (c,d): A heterogeneous mass, characterized by enhancing compartments and necrotic areas is seen (c). An enhancing capsule is depicted on PVP (d) (arrows). (e,f): There is a transient zone of hyperenhancement around the outer margin of the nodule (e) (arrowheads), which fades on PVP (f).
Figure 7
Figure 7
HCC with atypical imaging features; Cirrhotomimetic HCC (a,b) and Progenitor-type HCC (c,d,e) (late arterial, portal, and delayed phase, respectively). (a,b): Cirrhotomimetic HCC with TIV. There is marked diffuse heterogenous appearance of the left liver lobe with subtle arterial enhancement and “wash-out” accompanied with hyperenhancing portal vein tumor thrombus, displaying prominent neovascularity (thread and streak sign) (a) (arrows). (c,d,e): Progenitor-type HCC. There is a mass with irregular, non-smooth arterial enhancing rim (arrow). Note also the enhancing tissue inside the middle hepatic vein (arrowhead) (c) protruding into the IVC (arrowhead) (e). With the exception of cHCC-CCA, TIV is consider a fairly specific feature of HCC in a cirrhotic liver since ICC more frequently encases rather than invades veins.
Figure 8
Figure 8
CT perfusion allows the accurate identification and characterization of HCC lesions. In this 69-year-old patient with cirrhosis, a 12-mm nodular lesion in the right liver lobe (arrow) can be easily distinguished from surrounding liver parenchyma on CT perfusion (ad), with higher values on the Blood Flow (a), Arterial Liver Perfusion (b), and Hepatic Perfusion Index (d) parametric maps and a lower value on the Portal Venous Perfusion (c) map. The lesion is shown on conventional 4-phase CT (eh), which was performed on the same day as CT perfusion with arterial phase hyperenhancement (f) and wash-out on the portal-venous (g) and delayed phase (h), which corresponds to LI-RADS 5. BF; Blood Flow, ALP; Arterial Liver Perfusion, PLP; Portal Liver Perfusion, HPI; Hepatic Perfusion Index.
Figure 9
Figure 9
CT Liver Perfusion (CTLP) can complement other imaging modalities for establishing the diagnosis of HCC in difficult cases. This 70-year-old cirrhotic patient was previously treated for HCC with transarterial chemoembolization and presented with a 22-mm subdiaphragmatic lesion in liver segment 8 upon follow-up (arrows). The lesion had a high signal on T2 (a) and T1 (b) MRI. Contrast enhancement (c) and wash-out (d) could not be assessed on MRI due to the presence of artifacts. The MSI map of CTLP (e) clearly shows avid contrast enhancement in the HCC lesion, which was later confirmed with selective angiography (h). Although the Hepatic Arterial Blood Flow (f) and Hepatic Arterial Fraction (g) parametric maps show high values in the HCC lesion, it cannot be differentiated from surrounding parenchyma due to cirrhosis and prior chemoembolization, which alter normal liver hemodynamics. MSI; Mean Slope of Increase, HABF; Hepatic Arterial Blood Flow, HAF; Hepatic Arterial Fraction.
Figure 10
Figure 10
Evolution of a cirrhotic nodule into HCC. No suspicious lesions are identified on the T2 (a) and DWI (b) sequence of this 66-year-old man with cirrhosis due to hepatitis B infection. On the follow-up scan, performed 3 months later, increased T2 signal (c) is now observed in a nodule in segment V, which is associated with diffusion restriction (arrow) (d). After contrast administration, arterial enhancements (e) without delayed wash-out (f) are seen; absence of wash-out is frequent in early HCCs.
Figure 11
Figure 11
This 48-year-old woman with a history of β-thalassemia major and cirrhosis was followed-up after successful locoregional treatment of two small HCCs. In liver segment II, a 5-mm high T2 signal focus is seen in an anterior subcapsular location (a) with associated restricted diffusion (arrow) (b). The lesion shows arterial enhancement (c) and no uptake of the hepatospecific contrast on the hepatobiliary phase (d). Although findings are highly suspicious, the lesion cannot be definitely characterized as HCC, due to its small size. On the subsequent follow up CT, interval growth and typical wash-in/wash-out are now present (e,f).
Figure 12
Figure 12
A large HCC is depicted in the right liver lobe of this 81-year-old man. The tumor is surrounded by a capsule, nicely seen as a thin, low signal line on the fat-suppressed T2 sequence (arrowheads) (a) and shows inhomogeneous but predominantly high T2 signal intensity. Areas of fat are clearly shown in the in/out of phase images (asterisk) (b,c). This marked heterogeneity is known as the “mosaic” pattern. After contrast administration, mottled arterial enhancement is noted (d); definite wash-out and capsular enhancement (arrows) are seen on the portal phase (e).
Figure 13
Figure 13
Sixty-five-year-old man with cirrhosis. On the T2 sequence, a nodular high T2 lesion is vaguely seen (arrowheads) (a). The lesion appears hyperintense on the in-phase image (b) and slightly hypo-intense on the out-of-phase image (arrowheads) (c), suggesting the presence of fat. On the hepatobiliary phase after gadoxetic acid administration, a small nodule with markedly decreased signal (no contrast uptake) is evident in the left aspect of the larger lesion (arrow), suggesting focal de-differentiation in a dysplastic fatty nodule and early HCC formation (“nodule in nodule” sign) (d).
Figure 14
Figure 14
An 11-cm tumor (arrowheads) is incidentally discovered in a 70-year-old man without history of viral hepatitis, non-alcoholic fatty liver disease, or cirrhosis. Otherwise, the lesion shows typical HCC imaging features such as high T2 signal intensity (a), diffusion restriction (b), arterial hyperenhancement ©, and wash-out during the portal phase (d). Due to the absence of risk factors, a biopsy was performed that confirmed the radiological diagnosis.
Figure 15
Figure 15
Expected post-treatment changes after microwave ablation (MWA). During US screening examination of a 70-years-old cirrhotic patient, two suspicious nodules, one 2 cm in segment VI and one 1.2 cm more centrally, were found. (a) Mean Slope of Increase (MSI) map of CT Liver Perfusion (CTLP) in coronal plane of the same patient shows the two hypervascular lesions in the right liver lobe, both of which proved to be HCCs (arrows). A wedge resection of the inferior tumor was performed. Post-operative arterial phase MRI in axial plane (b) and MSI map of CLTP in coronal plane (c) revealed once again the centrally-located viable tumor (arrowhead) alongside post-operative changes in the area of the resection (double arrows). A percutaneous MWA of the remaining tumor was subsequently decided. (d) Axial non-enhanced periprocedural CT shows the microwave antenna placed inside the tumor. Post-procedural portal phase CT in coronal (e) and axial (f) plane shows lack of contrast enhancement due to coagulative necrosis in the ablation zone and needle tract with surrounding hyperemia (black arrowheads). Note the safe ablation margin compared to reference images (b,c). MSI map of follow-up CTLP one month later in coronal (g) and axial plane (h) shows remaining hyperemia adjacent to the ablation margin, which should not be interpreted as residual or recurrent tumor.
Figure 16
Figure 16
CT Liver perfusion (CTLP) imaging findings before and after transarterial chemoembolization (TACE) of multiple HCC nodules. (a,b) T1-w MRI scan of 72-year-old cirrhotic patient on arterial (a) and portal phase (b) after gadolinium injection showing three liver masses with arterial phase hyperenhancement (arrows in a), wash-out, and capsule (arrows in (b)) consistent with HCCs. (c) Mean slope of increase (MSI) after CTLP confirms MRI findings, showing all hypervascular lesions in red color (black arrows) surrounded by yellow rim, which reflects perfusion disorders. (d) Angiographic view of the liver before TACE revealed the malignant hypervascularized overlapping lesions (between black arrows). The smaller subcapsular lesion could not be clearly depicted. The lesions were subsequently treated with selective TACE with Epirubicin-loaded beads. (e) Follow-up CTLP one month later (MSI map) revealed extensive necrosis of the chemo-embolized tumors (arrowheads), with a viable area in the dorsolateral portion of the larger mass (double arrows). (f) During a second TACE session, the residual malignant tumor lesions were depicted and treated with super-selective TACE. (g,h). Follow-up CTLP a month after second TACE (MSI map) revealed no signs of viability in the previously found tumors (arrowheads). However, a new, small 1.5-cm lesion had appeared.

Similar articles

Cited by

References

    1. Global Cancer Observatory. [(accessed on 5 August 2022)]. Available online: http://globocan.iarc.fr/Default.aspx.
    1. Rumgay H., Shield K., Charvat H., Ferrari P., Sornpaisarn B., Obot I., Islami F., Lemmens V.E.P.P., Rehm J., Soerjomataram I. Global burden of cancer in 2020 attributable to alcohol consumption: A population-based study. Lancet Oncol. 2021;22:1071–1080. doi: 10.1016/S1470-2045(21)00279-5. - DOI - PMC - PubMed
    1. Marrero J.A., Kulik L.M., Sirlin C.B., Zhu A.X., Finn R.S., Abecassis M.M., Roberts L.R., Heimbach J.K. Diagnosis, Staging, and Management of Hepatocellular Carcinoma: 2018 Practice Guidance by the American Association for the Study of Liver Diseases. Hepatology. 2018;68:723–750. doi: 10.1002/hep.29913. - DOI - PubMed
    1. Galle P.R., Forner A., Llovet J.M., Mazzaferro V., Piscaglia F., Raoul J.-L., Schirmacher P., Vilgrain V. EASL Clinical Practice Guidelines: Management of hepatocellular carcinoma. J. Hepatol. 2018;69:182–236. doi: 10.1016/j.jhep.2018.03.019. - DOI - PubMed
    1. Omata M., Cheng A.-L., Kokudo N., Kudo M., Lee J.M., Jia J., Tateishi R., Han K.-H., Chawla Y.K., Shiina S., et al. Asia–Pacific clinical practice guidelines on the management of hepatocellular carcinoma: A 2017 update. Hepatol. Int. 2017;11:317–370. doi: 10.1007/s12072-017-9799-9. - DOI - PMC - PubMed

LinkOut - more resources