. 2022 Aug 20;14(16):4017.
doi: 10.3390/cancers14164017.

DWI Metrics Differentiating Benign Intraductal Papillary Mucinous Neoplasms from Invasive Pancreatic Cancer: A Study in GEM Models

Affiliations

DWI Metrics Differentiating Benign Intraductal Papillary Mucinous Neoplasms from Invasive Pancreatic Cancer: A Study in GEM Models

Miguel Romanello Joaquim et al. Cancers (Basel). .

Abstract

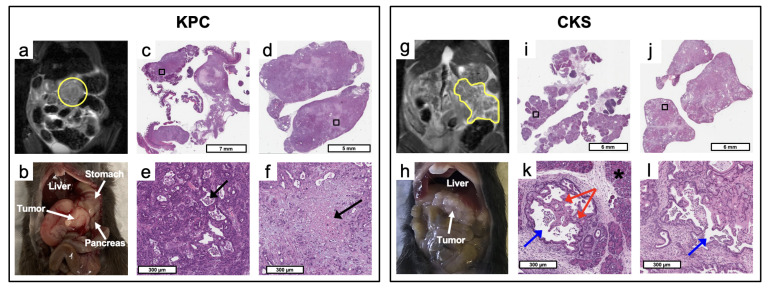
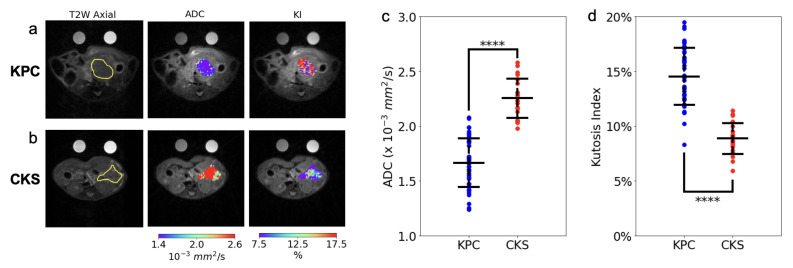
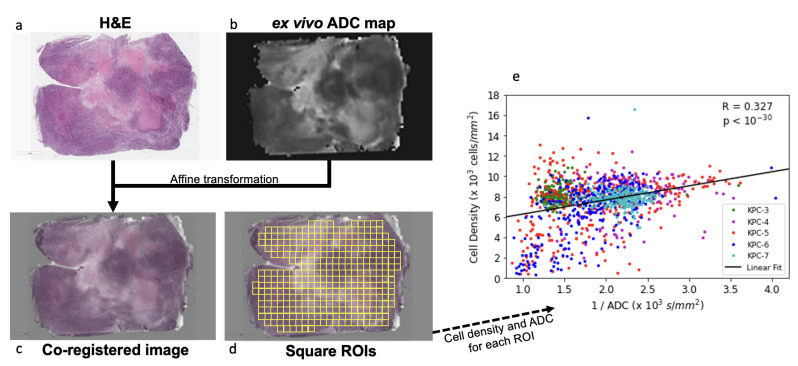
KPC (KrasG12D:Trp53R172H:Pdx1-Cre) and CKS (KrasG12D:Smad4L/L:Ptf1a-Cre) mice are genetically engineered mouse (GEM) models that capture features of human pancreatic ductal adenocarcinoma (PDAC) and intraductal papillary mucinous neoplasms (IPMN), respectively. We compared these autochthonous tumors using quantitative imaging metrics from diffusion-weighted MRI (DW-MRI) and dynamic contrast enhanced (DCE)-MRI in reference to quantitative histological metrics including cell density, fibrosis, and microvasculature density. Our results revealed distinct DW-MRI metrics between the KPC vs. CKS model (mimicking human PDAC vs. IPMN lesion): the apparent diffusion coefficient (ADC) of CKS tumors is significantly higher than that of KPC, with little overlap (mean ± SD 2.24±0.2 vs. 1.66±0.2, p<10−10) despite intratumor and intertumor variability. Kurtosis index (KI) is also distinctively separated in the two models. DW imaging metrics are consistent with growth pattern, cell density, and the cystic nature of the CKS tumors. Coregistration of ex vivo ADC maps with H&E-stained sections allowed for regional comparison and showed a correlation between local cell density and ADC value. In conclusion, studies in GEM models demonstrate the potential utility of diffusion-weighted MRI metrics for distinguishing pancreatic cancer from benign pancreatic cysts such as IPMN.

Keywords: diffusion-weighted MRI; dynamic contrast-enhanced MRI; genetically engineered mouse model; intraductal papillary mucinous neoplasms; neoplastic progression; pancreatic adenocarcinoma.


Conflict of interest statement

The authors declare no conflict of interest.

Figures

Figure 1
Figure 1
MRI, gross dissection, and pathological features of KPC and CKS tumors. (a) T2W coronal MRI view of a KPC mouse, (b) gross dissection, (c) H&E stained micrograph of a relatively small and (d) large KPC tumor specimen. (e) is the magnified region labeled in (c), showing the glandular structure (black arrow) formed by surrounding adenocarcinoma cells. (f) is the magnified necrotic tumor region (black arrow) labeled in (d). (g) T2W coronal MRI view of a CKS mouse, (h) gross dissection, (i) H&E stained micrograph of a relatively small and (j) large CKS tumor specimen. (k) is the magnified labeled region labeled in (i), revealing folding and papillary architecture formed by tumor cells (red arrow) growing inside the lumen (blue arrow) of an expanded pancreatic duct and residual pancreas (*). (l) is the magnified labeled region in (j), showing the lumen (blue arrow) of a duct expanded by neoplastic ductal epithelial cells.
Figure 2
Figure 2
Comparison of quantitative in vivo DW-MRI markers between KPC and CKS tumors. (a,b) display a T2W axial image and tumor ADC (color) and KI (color) map overlays, for a KPC and CKS tumor, respectively. (c,d) present ADC and KI values from individual KPC (n = 44) and CKS tumors (n = 20) along with the group mean and standard deviation. p-values are from two-tailed t-tests. ****: p < 1010.
Figure 3
Figure 3
Correlation between ADC and cell density in KPC model. (a) H&E stained section and (b) ex vivo ADC map were transformed to the same space via affine transformation to produce a (c) coregistered image. (d) Square ROIs were placed covering the entire section show a negative correlation (e) between ADC and cell density (R=0.38, p=1.6×1043).
Figure 4
Figure 4
Sirius red staining of a KPC and CKS tumor. Sirius red staining of KPC tumor specimen (a) reveals collagen (stained red) deposition around tumor cells and residual pancreatic glands (* in b). Glandular structures (arrows in c) are formed by surrounding tumor cells, with necrotic tumor cells are seen inside the glandular space. In CKS tumor specimen (d), strong depositions of collagen fibers are found surrounding the pancreatic ducts (e), with tumor cells (red arrow) growing inside the lumen (blue arrow) folding and forming a papillary architecture. Magnified region (f) shows collagen depositions are also found surrounding and tumor nodules and the papillary formation of necrotic tumor cells inside expanded ducts (red arrow).
Figure 5
Figure 5
Comparison of quantitative DCE-MRI features and parametric maps between KPC and CKS tumors. For 2 KPC and 2 CKS mice, contrast enhanced images before, shortly after, and minutes after contrast agent bolus are shown, as well as resulting Ktrans and ve maps of the tumor ROI and the signal time-course for the full tumor and spinal muscle (reference region) ROIs. t marks the time after initiation of DCE acquisition. Contrast media is injected at 120 s. Images are cropped. Refer to Figure S1 for an example of ROI placed for spinal muscle.
Figure 6
Figure 6
CD31 staining of KPC and CKS tumor. CD31 stained micrographs are shown for two KPC tumor specimens (b,d,f) with the corresponding H&E micrographs from adjacent sections (a,c,e). CD31 stained micrographs are shown for two CKS tumor specimens (h,j) with the corresponding H&E micrographs (g,i). The blue tint in CKS slides from hematoxylin counter staining does not interfere with quantification of microvasculature density by the classifier.

Similar articles

Cited by

References

    1. Kojima K., Vickers S.M., Adsay N.V., Jhala N.C., Kim H.-G., Schoeb T.R., Grizzle W.E., Klug C.A. Inactivation of Smad4 accelerates Kras(G12D)-mediated pancreatic neoplasia. Cancer Res. 2007;67:8121–8130. doi: 10.1158/0008-5472.CAN-06-4167. - DOI - PubMed
    1. Hingorani S.R., Wang L., Multani A.S., Deramaudt R.H., Hruban R.H., Rustgi A.K., Chang S., Tuveson D.A. Trp53R172H and KrasG12D cooperate to promote chromosomal instability and widely metastatic pancreatic ductal adenocarcinoma in mice. Cancer Cell. 2005;7:469–483. doi: 10.1016/j.ccr.2005.04.023. - DOI - PubMed
    1. Hingorani S.R., Petricoin E.F., Maitra A., Rajapakse V., King C., Jacobetz M.A., Ross S., Conrads T.P., Veenstra T.D., Hitt B.A., et al. Preinvasive and invasive ductal pancreatic cancer and its early detection in the mouse. Cancer Cell. 2003;4:437–450. doi: 10.1016/S1535-6108(03)00309-X. - DOI - PubMed
    1. Bardeesy N., Cheng K.-H., Berger J.H., Chu G.C., Pahler J., Olson P., Hezel A.F., Horner J., Lauwers G.Y., Hanahan D., et al. Smad4 is dispensable for normal pancreas development yet critical in progression and tumor biology of pancreas cancer. Genes Dev. 2006;20:3130–3146. doi: 10.1101/gad.1478706. - DOI - PMC - PubMed
    1. Tanaka M., Fernandez-del Castillo C., Kamisawa T., Jang P., Levy P., Ohtsuka T., Saliva R., Shimizu Y., Tada M., Wolfgang C.L. Revisions of international consensus Fukuoka guidelines for the management of IPMN of the pancreas. Pancreatology. 2017;17:738–753. doi: 10.1016/j.pan.2017.07.007. - DOI - PubMed

LinkOut - more resources