. 2022 Aug 10;13(8):1420.
doi: 10.3390/genes13081420.

microRNA Expression Profile of Purified Alveolar Epithelial Type II Cells

Affiliations

microRNA Expression Profile of Purified Alveolar Epithelial Type II Cells

Stefan Dehmel et al. Genes (Basel). .

Abstract

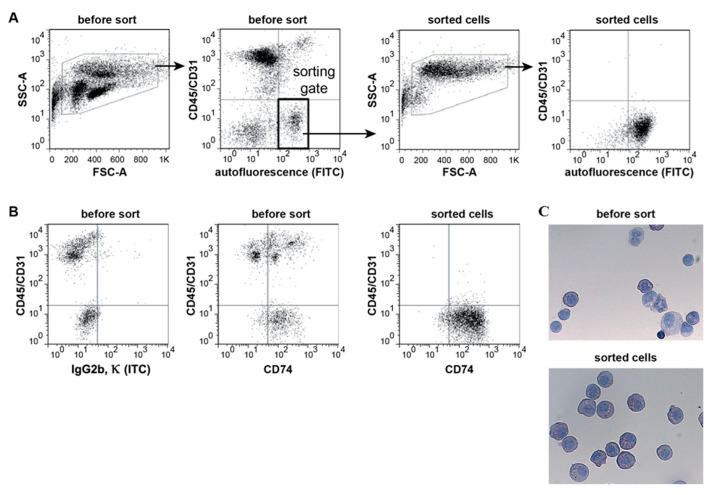
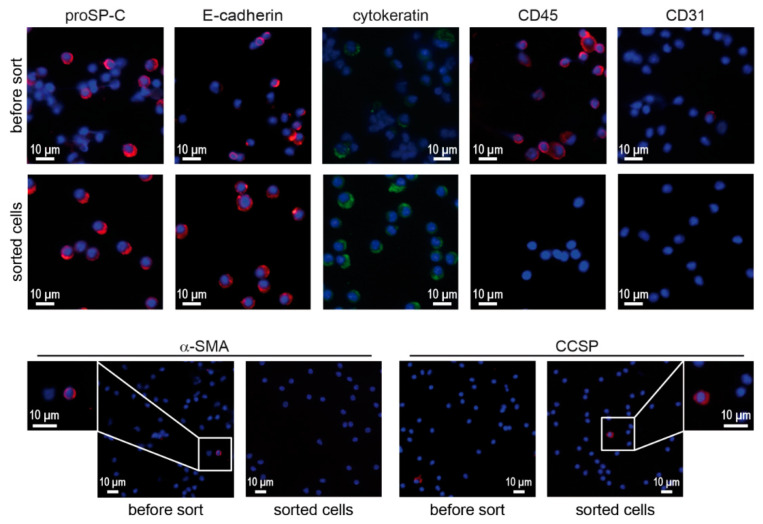
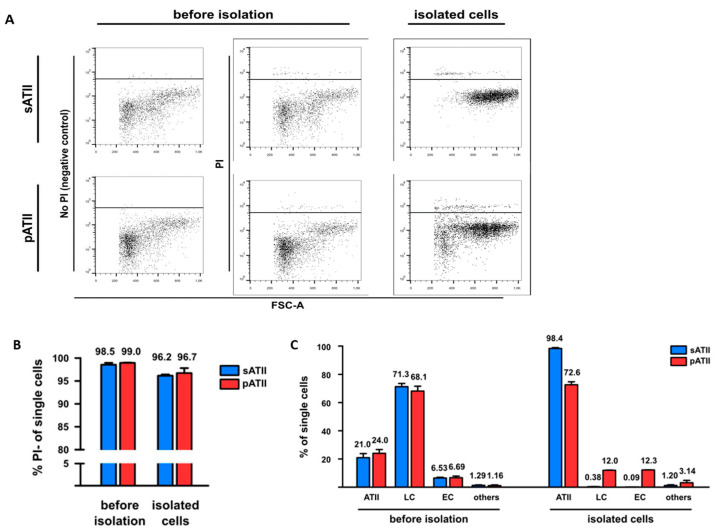
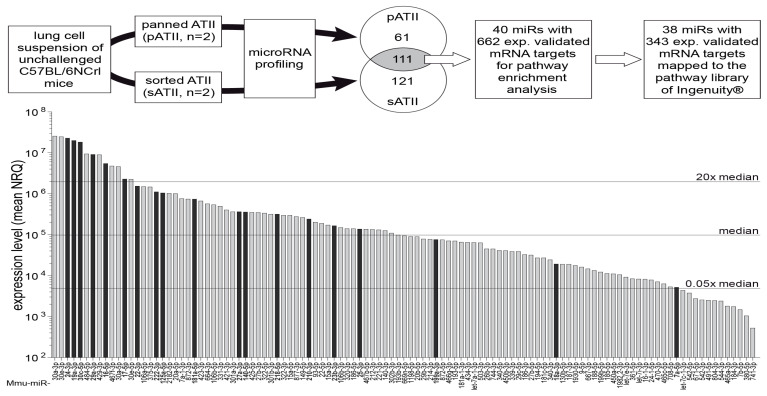
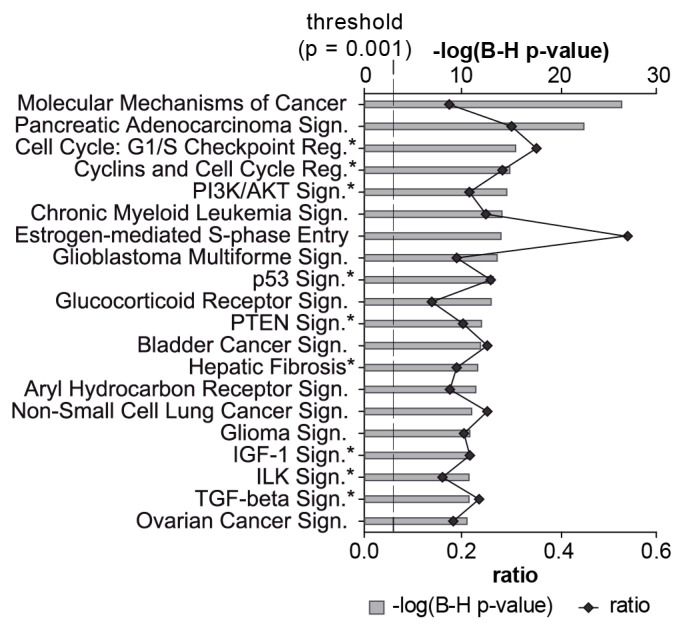
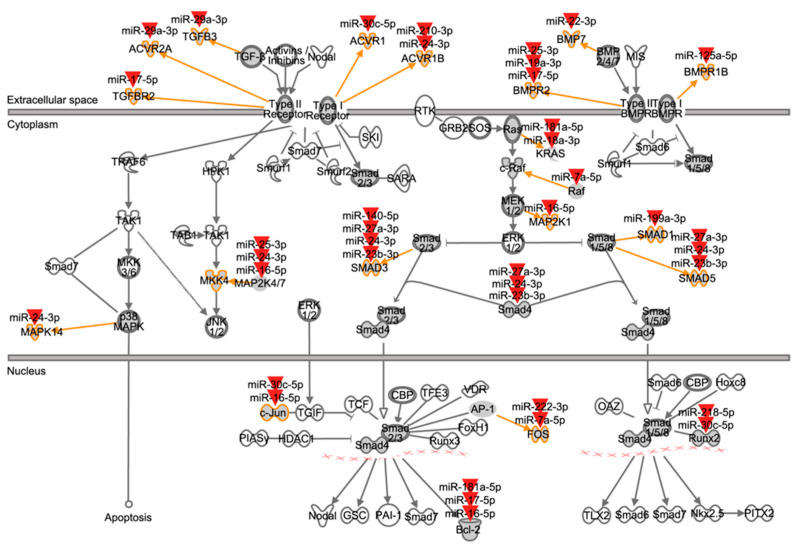
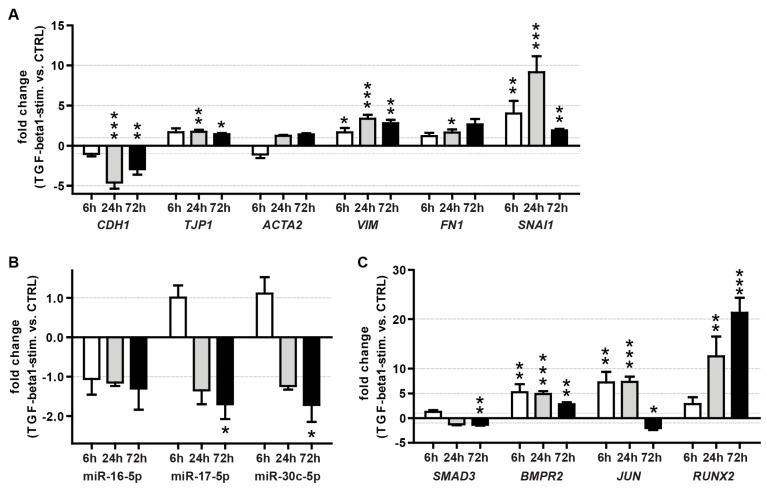
Alveolar type II (ATII) cells are essential for the maintenance of the alveolar homeostasis. However, knowledge of the expression of the miRNAs and miRNA-regulated networks which control homeostasis and coordinate diverse functions of murine ATII cells is limited. Therefore, we asked how miRNAs expressed in ATII cells might contribute to the regulation of signaling pathways. We purified "untouched by antibodies" ATII cells using a flow cytometric sorting method with a highly autofluorescent population of lung cells. TaqMan® miRNA low-density arrays were performed on sorted cells and intersected with miRNA profiles of ATII cells isolated according to a previously published protocol. Of 293 miRNAs expressed in both ATII preparations, 111 showed equal abundances. The target mRNAs of bona fide ATII miRNAs were used for pathway enrichment analysis. This analysis identified nine signaling pathways with known functions in fibrosis and/or epithelial-to-mesenchymal transition (EMT). In particular, a subset of 19 miRNAs was found to target 21 components of the TGF-β signaling pathway. Three of these miRNAs (miR-16-5p, -17-5p and -30c-5p) were down-modulated by TGF-β1 stimulation in human A549 cells, and concomitant up-regulation of associated mRNA targets (BMPR2, JUN, RUNX2) was observed. These results suggest an important role for miRNAs in maintaining the homeostasis of the TGF-β signaling pathway in ATII cells under physiological conditions.

Keywords: AECII; ATII; EMT; TGF-beta; alveolar epithelial type II cells; autofluorescence; flow cytometry; homeostasis; miRNAs; pathway analysis; type II pneumocytes.


Conflict of interest statement

The authors declare no conflict of interest.

Figures

Figure 1
Figure 1
FACS strategy and purity of sorted ATII cells. (A) ATII cells were sorted based on high autofluorescence (FITC-channel) and absence of CD45 and CD31 surface expression (left panels). CD45 and CD31 expression levels were measured in the same channel (APC) and the gate used for sorting is highlighted as a thick rectangle. Sorted cells were re-analysed using the same gating strategy (right panels). Removal of doublets based on FSC characteristics not shown. Dot plots are representative of four independent experiments. (B) Representative dot plots of cells stained for CD45, CD31 and intracellular CD74 before and after sorting (ITC: isotype control). (C) Light microscopic images of Papanicolaou-stained cytospin preparations of cells before and after sorting (×400). ATII cells show characteristic dark blue inclusions in the cytoplasm (n = 4, mean ± SEM).
Figure 2
Figure 2
Immunofluorescence for phenotypic markers on cytocentrifuge preparations of lung cell suspensions (before sorting) and sorted cells. Cytocentrifuge preparations of whole lung cell suspensions and sorted cells were stained for phenotypic markers associated with ATII cells (proSP-C, E-cadherin, cytokeratin), leukocytes (CD45), endothelial cells (CD31), smooth muscle cells (α-SMA) and Club cells (CCSP). Scale bars represent 10 μm.
Figure 3
Figure 3
Viability, phenotypic markers and phenotypic expression of sATII and pATII cells before and after isolation. (A) Whole lung suspensions without PI staining were used as negative controls (left panels). Viable cells were identified for sATII (upper row) and pATII (lower row) in the whole lung suspension (before isolation) and isolated cells were identified by PI exclusion (middle and right panels). (B) Flow cytometric analysis of the viability of sATII and pATII cell populations before and after isolation as determined by propidium iodide (PI) negativity. (C) Purity of sATII and pATII cell preparation before and after isolation. ATII cells were defined as CD45/31neg CD74pos cells, leukocytes as CD45/31-APCpos cells without CD31-PEpos cells and endothelial cells as CD31-PEpos. cells. Note that the CD31-PE antibody used recognizes a different epitope of CD31 than the CD31-APC antibody used for sorting. Each value is the mean of four independent experiments for sATII and two independent experiments for pATII. T-bars show the standard errors of the means (SEMs).
Figure 4
Figure 4
Workflow and miRNA expression profile of ATII cells. Lung single-cell suspensions were generated from unchallenged female C57BL/6NCrl mice. ATII cells were isolated either by negative selection (panning, pATII, n = 2) or by cell sorting (sATII, n = 2). Both cell preparations were subjected to miRNA profiling using TaqMan® array microfluidic cards (Life Technologies). In pATII and sATII, respectively, 61 and 121 miRNAs had fold differences larger than 1.5 (FC > 1.5). A cut set of 111 miRNAs with similar expression levels (|fold difference| ≤1.5) in pATII and sATII was identified and is represented as a bar diagram. For 40 of these bona fide ATII miRNAs, experimentally observed interactions with 662 mRNA targets were available in the Ingenuity® database and this information was used for pathway enrichment analysis, resulting in 38 miRNAs targeting 343 mRNAs in 145 pathways. Black bars indicate 19 miRNA targeting components of the TGF-β signaling pathway. The majority (16 out of 19) of these miRNAs were expressed above median level. A complete list of the miRNAs expressed in ATII cells is available as a spreadsheet file (see Table S2 supplementary material). n = 2 represents a biological replicate.
Figure 5
Figure 5
Top 20 enriched signaling pathways targeted by miRNAs expressed in ATII cells. The 111 miRNAs expressed at similar levels in pATII and sATII were used as inputs for the miRNA target filter module in Ingenuity®. The top 20 signaling pathways associated with the dataset are shown. The significance of this association is expressed by the probability (grey bars) that the association between the targets and the pathway is not due to chance (BH-adjusted p-value, Fisher’s exact test). The degree of miRNA interaction within a certain pathway was calculated as the ratio of the number of targets that map to a given pathway to the total number of molecules within the pathway (black line). The dashed line indicates the significance threshold at p = 0.001. An asterisk highlights signaling pathways that have been associated previously with fibrosis and/or EMT.
Figure 6
Figure 6
Mapping of ATII miRNAs to TGF-β signaling pathway components. This figure represents the canonical TGF-β signaling pathway from the Ingenuity® pathway library. Orange arrows and outlines indicate ATII miRNA targeted members within molecule families (dark grey icons). Red arrowheads symbolize ATII miRNAs. For example, TGFBR2 is a member of the type II TGF-β receptors, and its mRNA is targeted by miR-17-5p. Compare Table 4 for an overview of interactions.
Figure 7
Figure 7
Effect of TGF-β1 treatment on the expression of EMT markers (A), miRNAs (B) and TGF-β pathway miRNA targets (C) in A549 cells. Shown are the mean fold changes (TGF-β1 vs. vehicle control) at 6, 24 and 72 h after stimulation with human recombinant TGF-β1. The arithmetic mean of RNA18S5 and HPRT1 mRNA expression served as a normalizer for mRNA quantitation. The small nuclear RNA RNU6B served as a reference gene for miRNA quantitation. The results were derived from three independent experiments, with each time point measured in triplicate. T-bars indicate maximum fold changes based on SEMs for target and reference gene expression. Unpaired t-test, vs. control treatment: *: p < 0.05, **: p < 0.01, ***: p < 0.001.

Similar articles

Cited by

References

    1. Ambros V. The functions of animal microRNAs. Nature. 2004;431:350–355. doi: 10.1038/nature02871. - DOI - PubMed
    1. Lewis B.P., Shih I.H., Jones-Rhoades M.W., Bartel D.P., Burge C.B. Prediction of mammalian microRNA targets. Cell. 2003;115:787–798. doi: 10.1016/S0092-8674(03)01018-3. - DOI - PubMed
    1. Berezikov E. Evolution of microRNA diversity and regulation in animals. Nat. Rev. Genet. 2011;12:846–860. doi: 10.1038/nrg3079. - DOI - PubMed
    1. Sayed D., Abdellatif M. MicroRNAs in development and disease. Physiol. Rev. 2011;91:827–887. doi: 10.1152/physrev.00006.2010. - DOI - PubMed
    1. Bartel D.P. MicroRNAs: Genomics, biogenesis, mechanism, and function. Cell. 2004;116:281–297. doi: 10.1016/S0092-8674(04)00045-5. - DOI - PubMed

Publication types

LinkOut - more resources