

Heat Wave and Bushfire Meteorology in New South Wales, Australia: Air Quality and Health Impacts
- PMID: 36012020
- PMCID: PMC9407765
- DOI: 10.3390/ijerph191610388
Heat Wave and Bushfire Meteorology in New South Wales, Australia: Air Quality and Health Impacts
Abstract
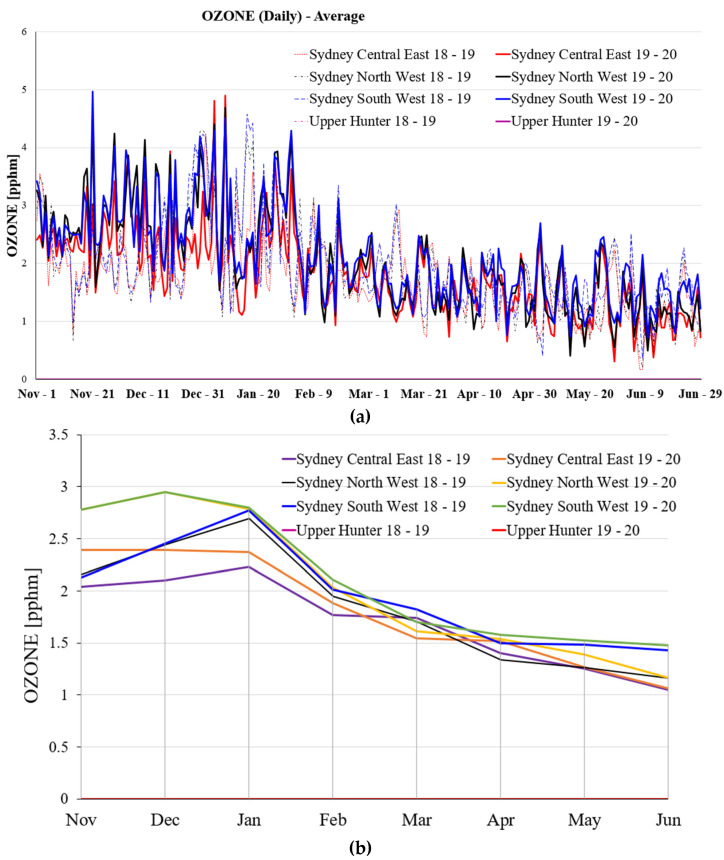
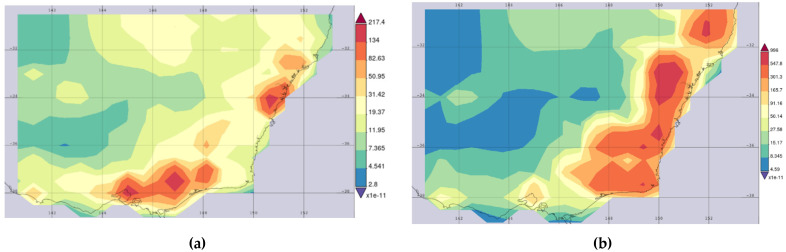
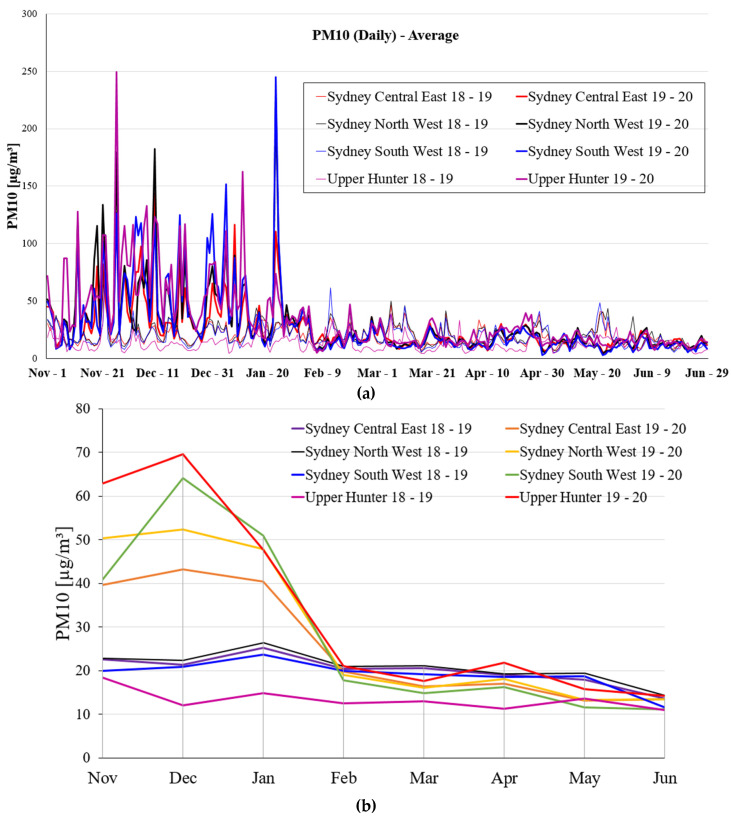
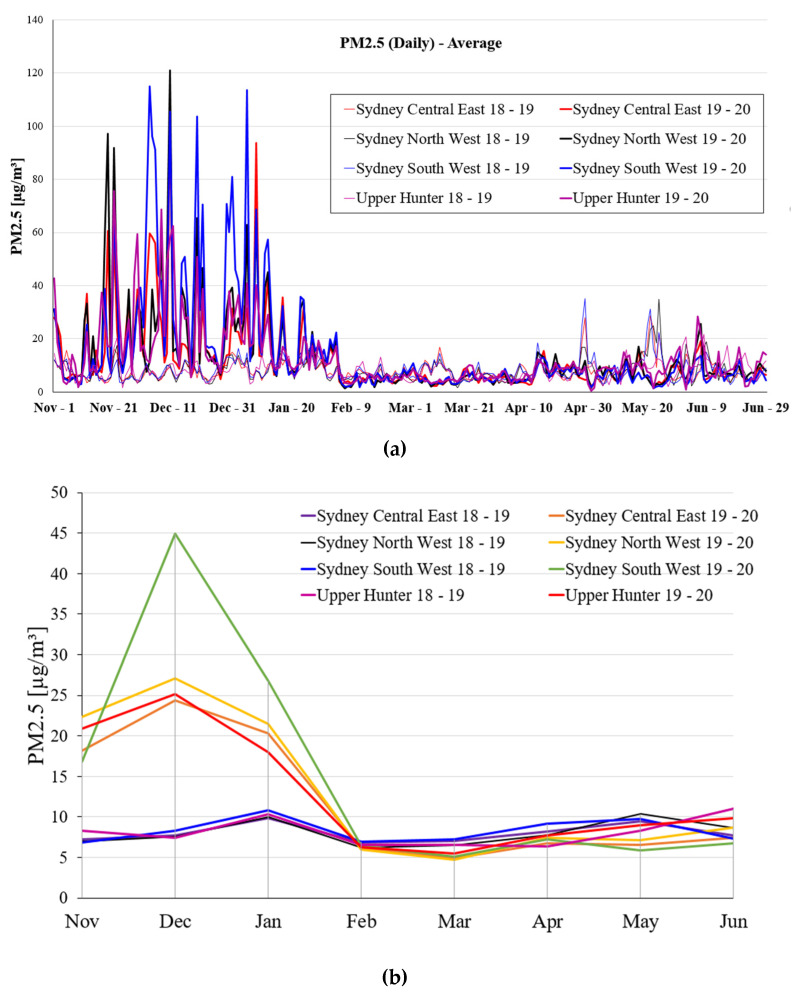
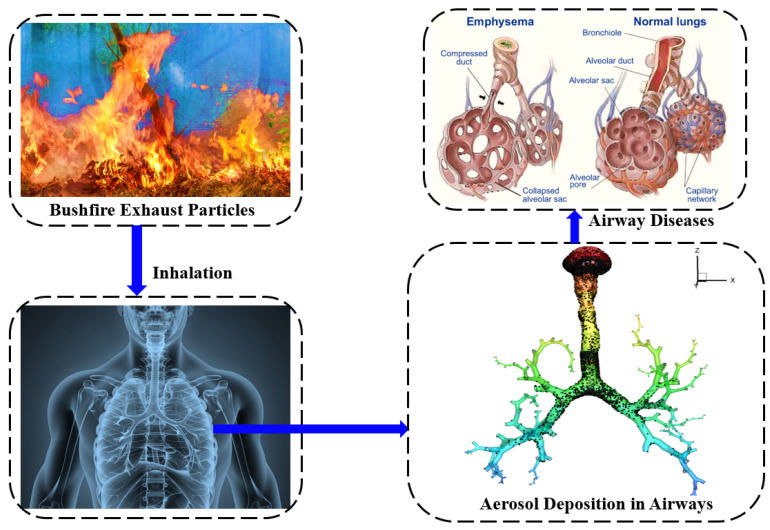
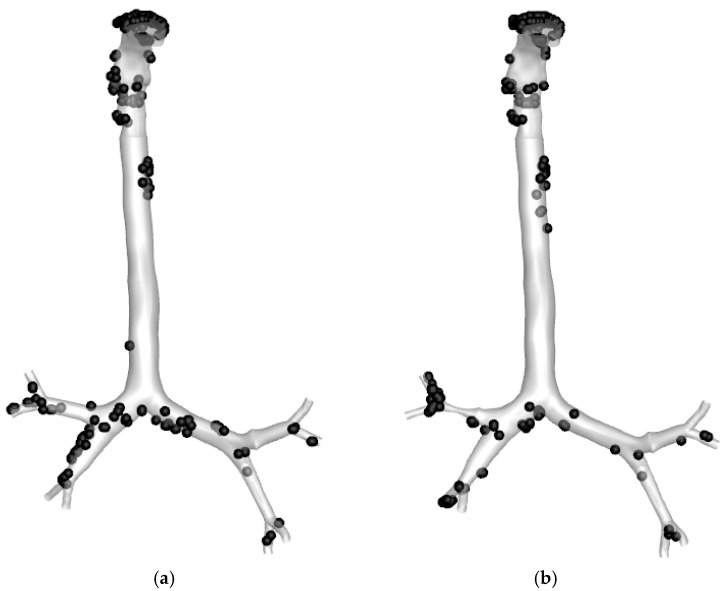
The depletion of air quality is a major problem that is faced around the globe. In Australia, the pollutants emitted by bushfires play an important role in making the air polluted. These pollutants in the air result in many adverse impacts on the environment. This paper analysed the air pollution from the bushfires from November 2019 to July 2020 and identified how it affects the human respiratory system. The bush fires burnt over 13 million hectares, destroying over 2400 buildings. While these immediate effects were devastating, the long-term effects were just as devastating, with air pollution causing thousands of people to be admitted to hospitals and emergency departments because of respiratory complications. The pollutant that caused most of the health effects throughout Australia was Particulate Matter (PM) PM2.5 and PM10. Data collection and analysis were covered in this paper to illustrate where and when PM2.5 and PM10, and other pollutants were at their most concerning levels. Susceptible areas were identified by analysing environmental factors such as temperature and wind speed. The study identified how these pollutants in the air vary from region to region in the same time interval. This study also focused on how these pollutant distributions vary according to the temperature, which helps to determine the relationship between the heatwave and air quality. A computational model for PM2.5 aerosol transport to the realistic airways was also developed to understand the bushfire exhaust aerosol transport and deposition in airways. This study would improve the knowledge of the heat wave and bushfire meteorology and corresponding respiratory health impacts.
Keywords: PM10; PM2.5; bushfire; health impacts; heat wave.
Conflict of interest statement
The authors declare no conflict of interest.
Figures
Similar articles
-
Smoke aerosols dispersion and transport from the 2013 New South Wales (Australia) bushfires.Environ Monit Assess. 2018 Jun 26;190(7):428. doi: 10.1007/s10661-018-6810-4. Environ Monit Assess. 2018. PMID: 29946831
-
Bushfire-smoke trigger hospital admissions with cerebrovascular diseases: Evidence from 2019-20 bushfire in Australia.Eur Stroke J. 2024 Jun;9(2):468-476. doi: 10.1177/23969873231223307. Epub 2024 Jan 23. Eur Stroke J. 2024. PMID: 38258746 Free PMC article.
-
The Summer 2019-2020 Wildfires in East Coast Australia and Their Impacts on Air Quality and Health in New South Wales, Australia.Int J Environ Res Public Health. 2021 Mar 29;18(7):3538. doi: 10.3390/ijerph18073538. Int J Environ Res Public Health. 2021. PMID: 33805472 Free PMC article.
-
Key Points in Air Pollution Meteorology.Int J Environ Res Public Health. 2020 Nov 11;17(22):8349. doi: 10.3390/ijerph17228349. Int J Environ Res Public Health. 2020. PMID: 33187359 Free PMC article. Review.
-
Exercise in bushfire smoke for high performance athletes: A Position Statement from the Australian Institute of SportEndorsed by Australasian College of Sport and Exercise Physicians (ACSEP) and Sport Medicine Australia (SMA).J Sci Med Sport. 2023 Feb;26(2):98-108. doi: 10.1016/j.jsams.2023.01.004. Epub 2023 Jan 13. J Sci Med Sport. 2023. PMID: 36858652 Review.
Cited by
-
Heat Illness Requiring Emergency Care for People Experiencing Homelessness: A Case Study Series.Int J Environ Res Public Health. 2022 Dec 9;19(24):16565. doi: 10.3390/ijerph192416565. Int J Environ Res Public Health. 2022. PMID: 36554443 Free PMC article.
-
A Numerical Systematic Review and Meta-Analysis of Diagnosing the Vibration Modes of the Cylindrical Shell in the MRI Machine.Biomed Eng Comput Biol. 2025 Jul 10;16:11795972251353069. doi: 10.1177/11795972251353069. eCollection 2025. Biomed Eng Comput Biol. 2025. PMID: 40657491 Free PMC article. Review.
References
-
- Phillips S., Wallis K., Lane A. Quantifying the impacts of bushfire on populations of wild koalas (Phascolarctos cinereus): Insights from the 2019/2020 fire season. Ecol. Manag. Restor. 2021;22:80–88. doi: 10.1111/emr.12458. - DOI
-
- Law B.S., Gonsalves L., Burgar J., Brassil T., Kerr I., O’Loughlin C. Fire severity and its local extent are key to assessing impacts of Australian mega-fires on koala (Phascolarctos cinereus) density. Glob. Ecol. Biogeogr. 2022;31:714–726. doi: 10.1111/geb.13458. - DOI
-
- Dowdy Andrew J. Seamless climate change projections and seasonal predictions for bushfires in Australia. J. South. Hemisph. Earth Syst. Sci. 2020;70:120–138. doi: 10.1071/ES20001. - DOI
MeSH terms
Substances
LinkOut - more resources
Full Text Sources
Medical
