. 2022 Aug 10;23(16):8926.
doi: 10.3390/ijms23168926.

Alterations of Mitochondrial Structure in Methamphetamine Toxicity

Affiliations

Alterations of Mitochondrial Structure in Methamphetamine Toxicity

Paola Lenzi et al. Int J Mol Sci. .

Abstract

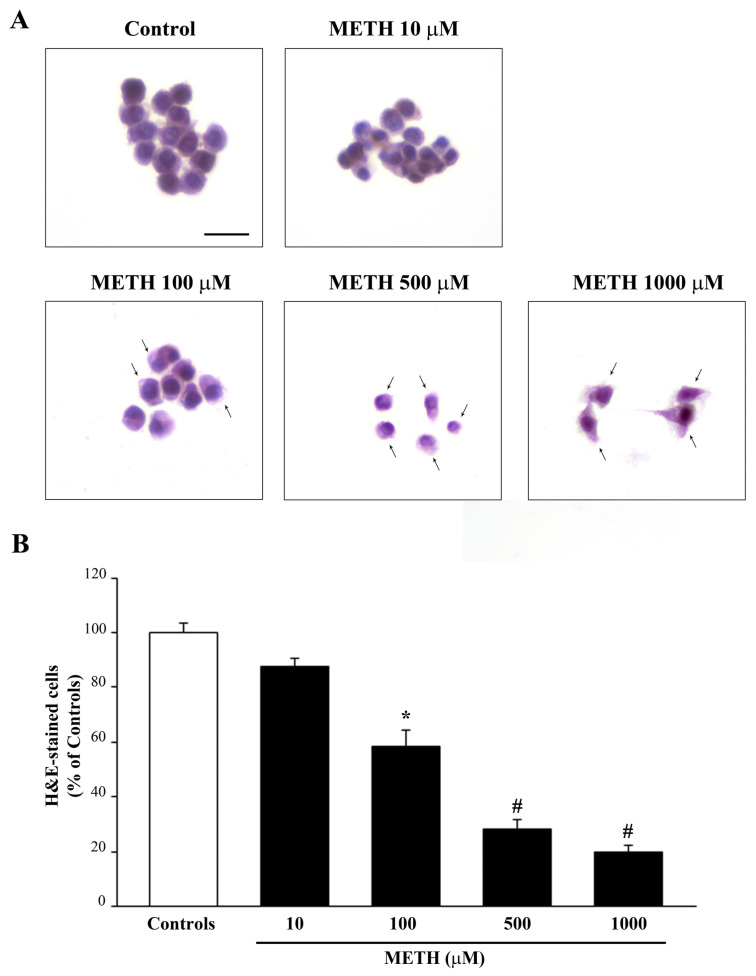
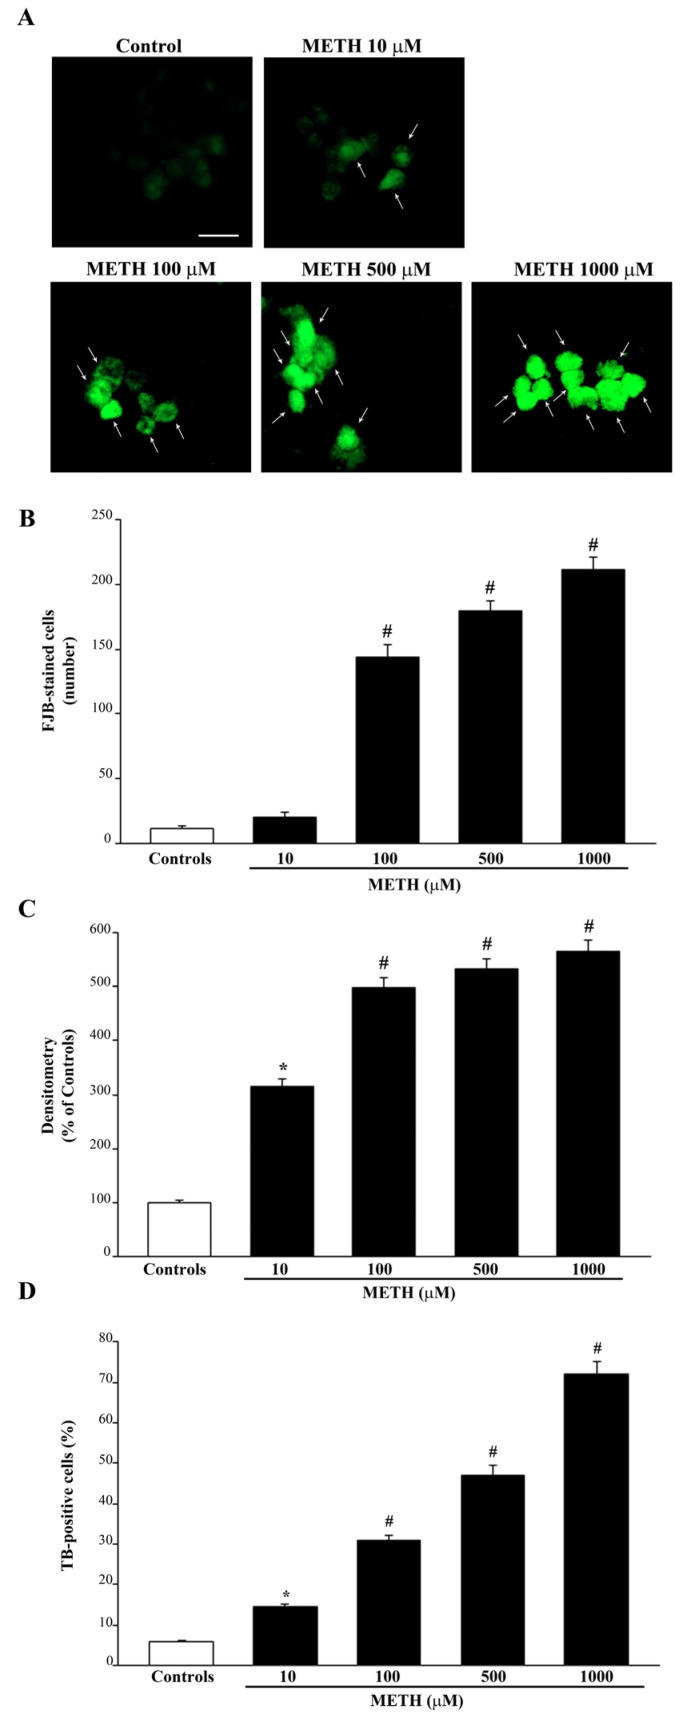
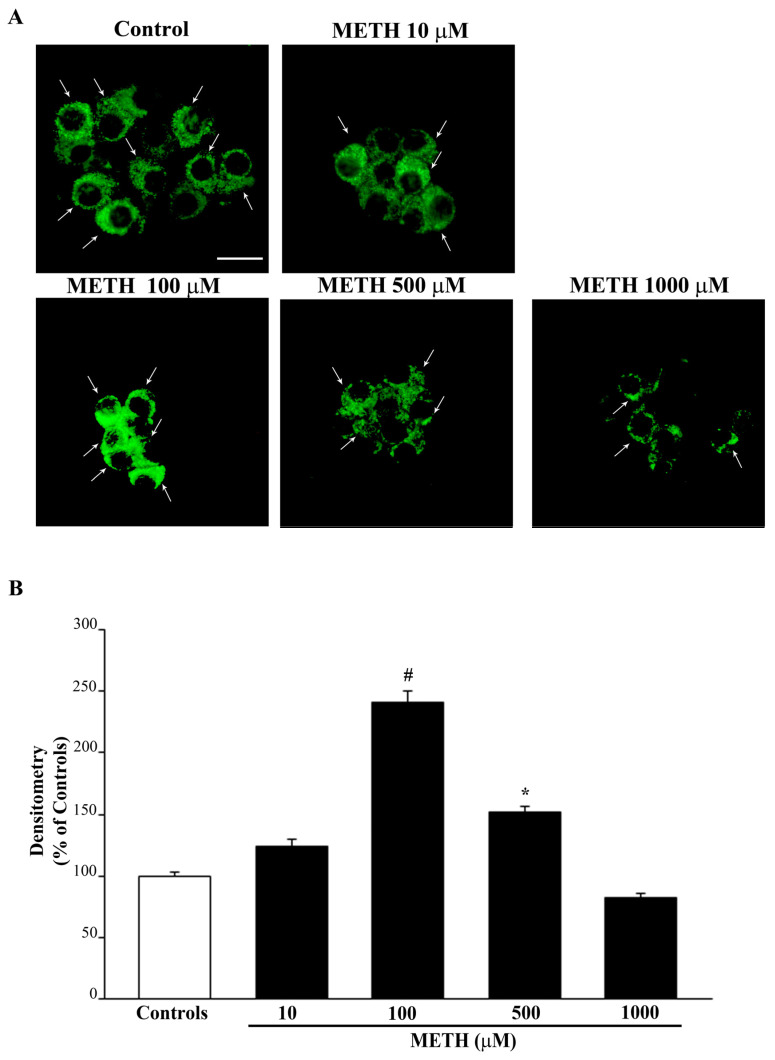
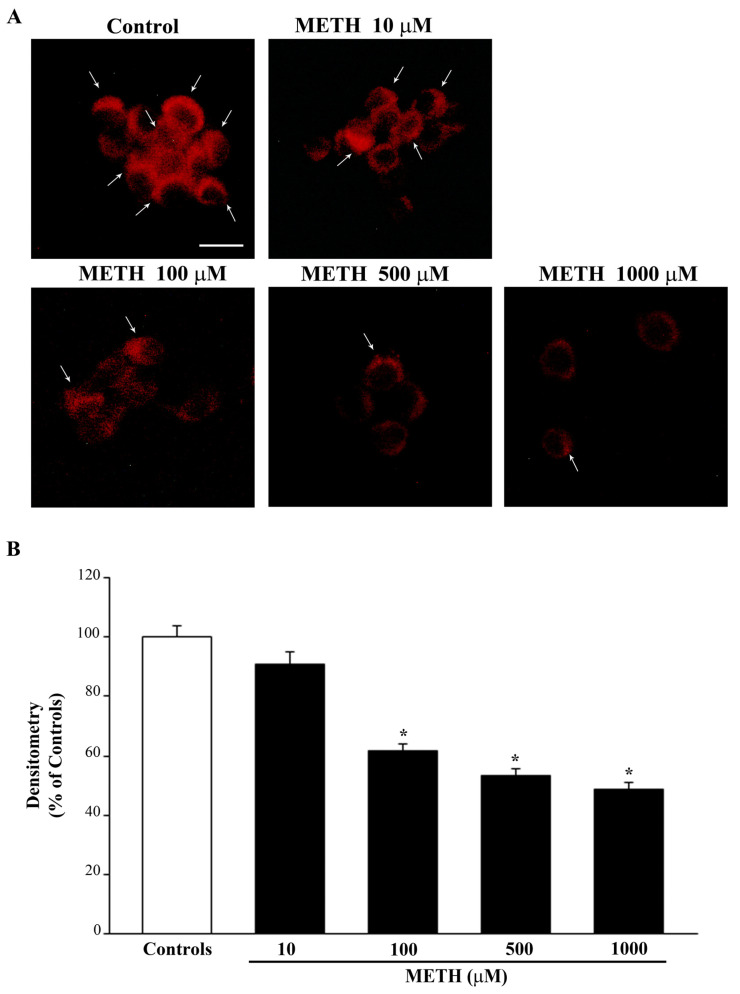
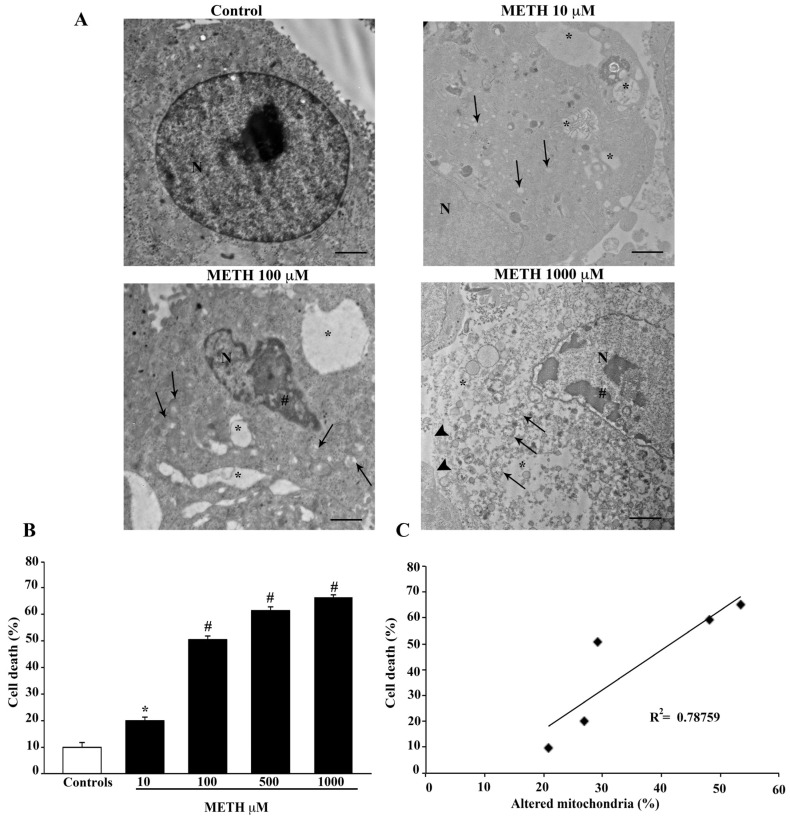
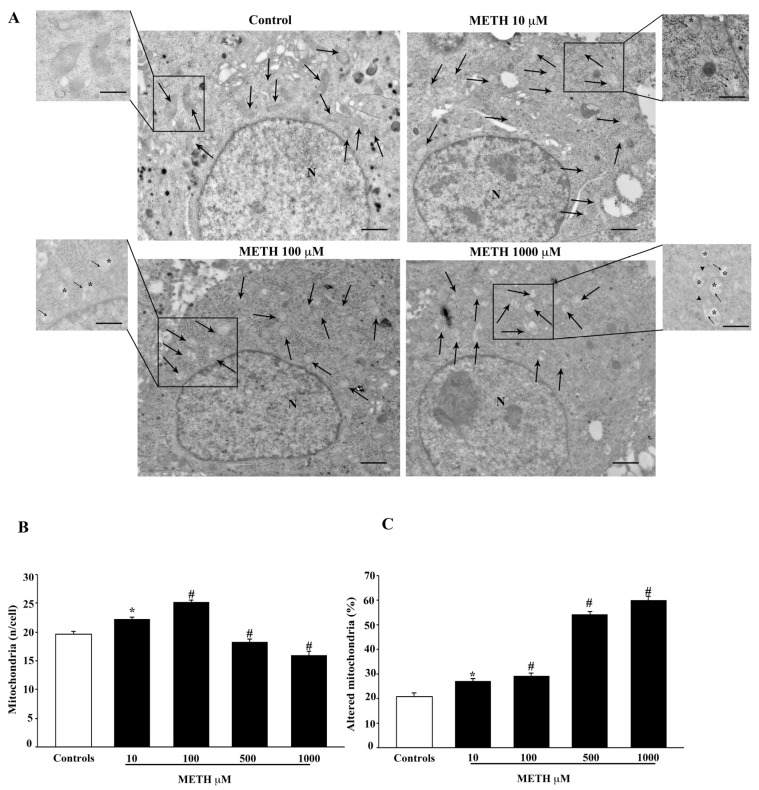
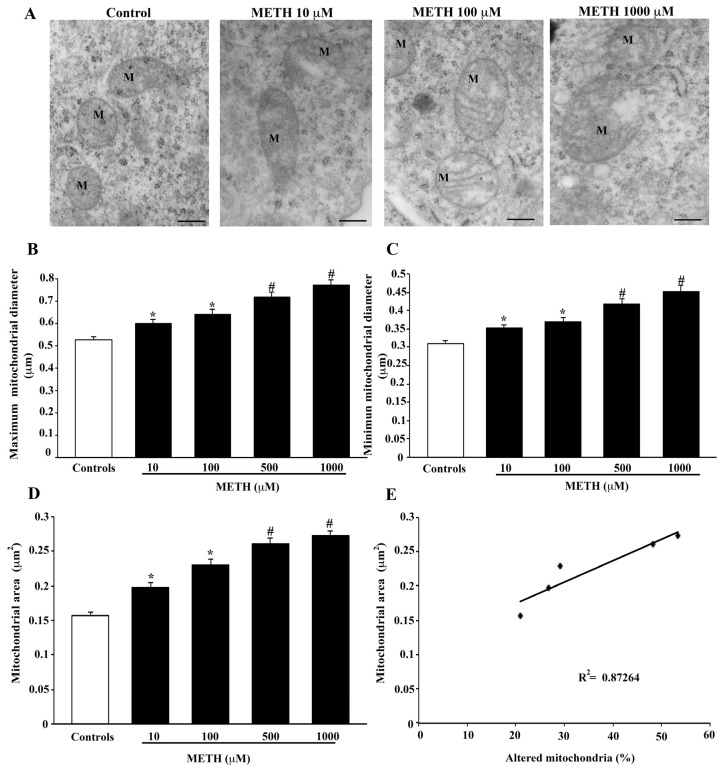
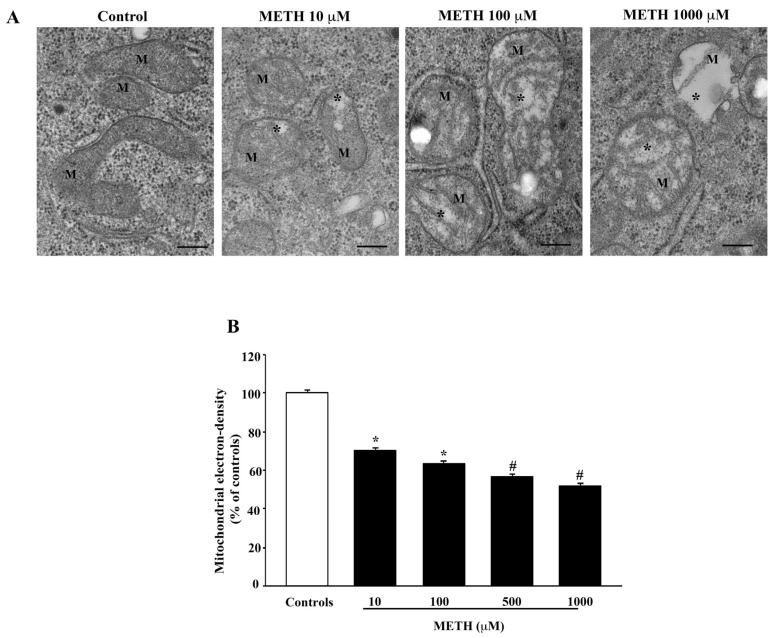
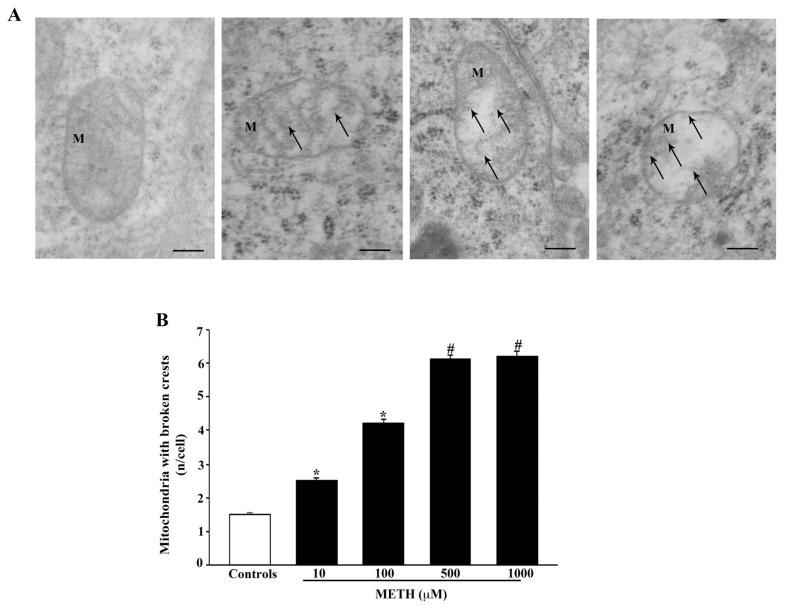
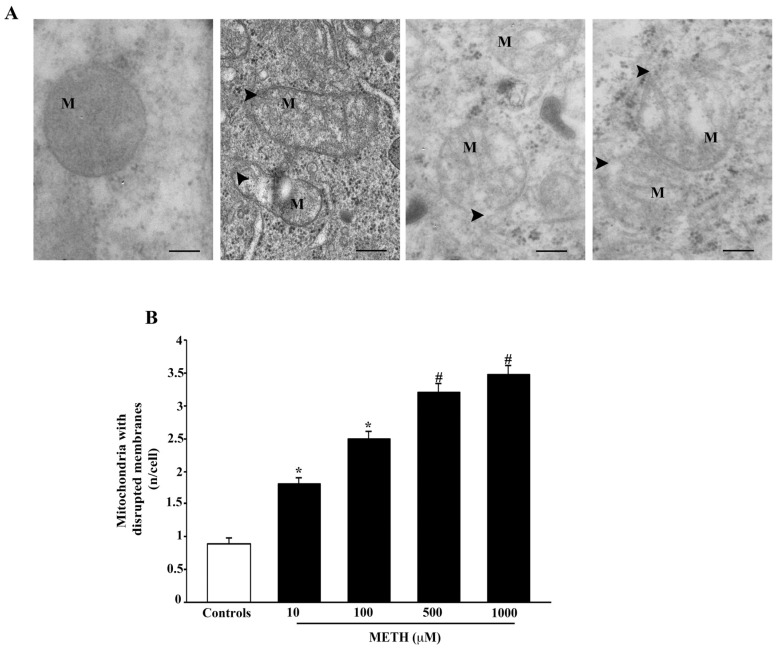
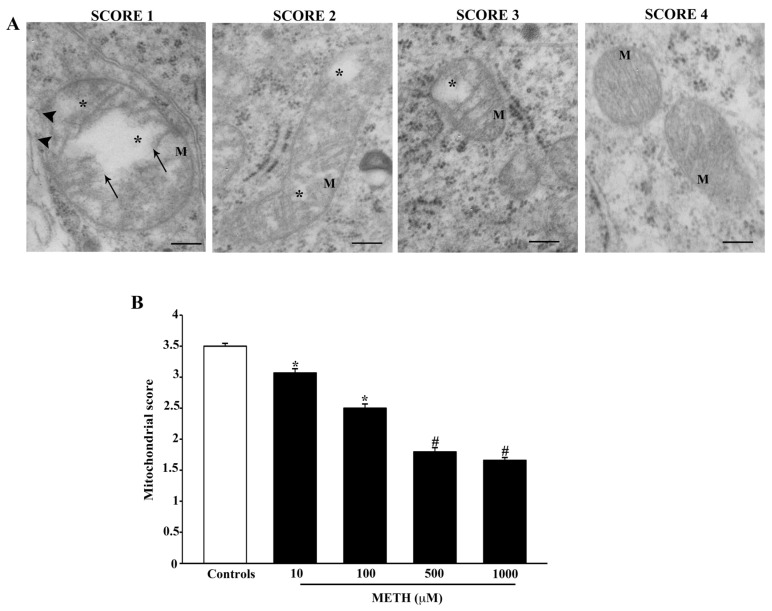
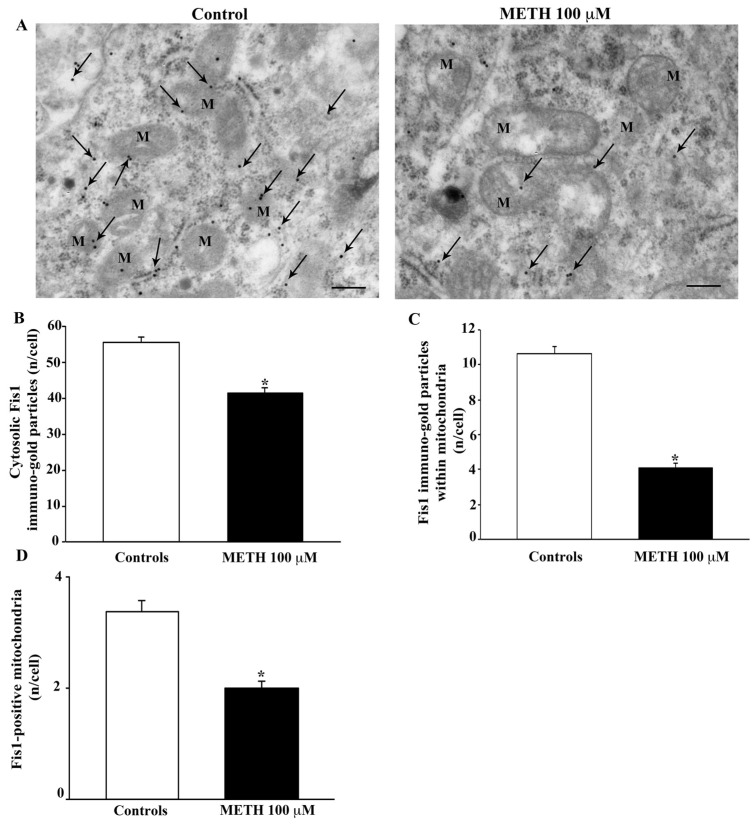
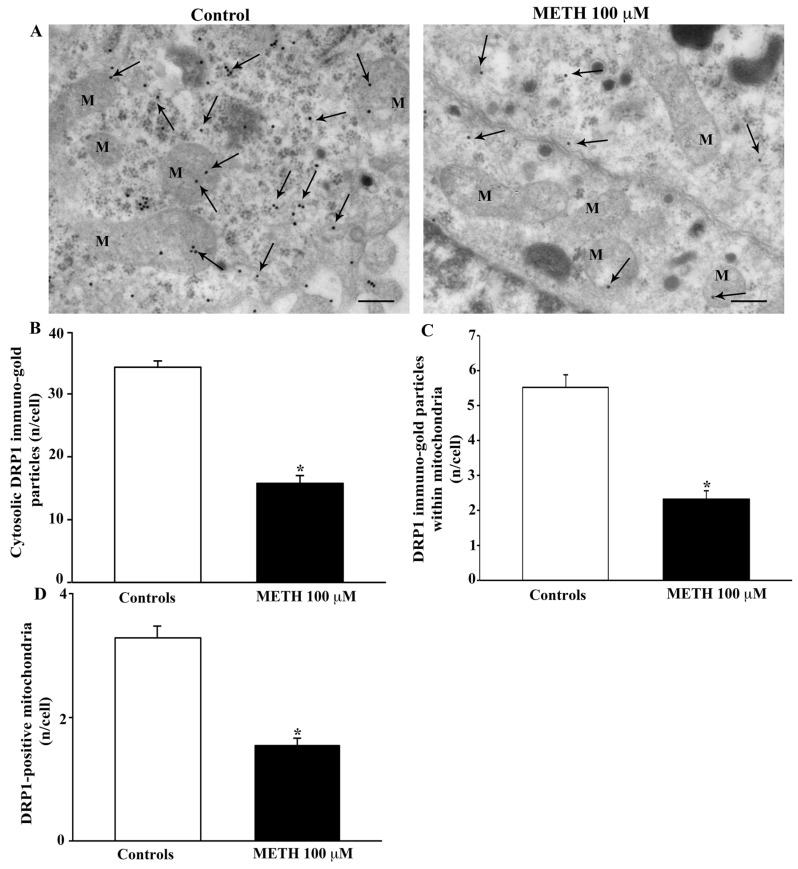
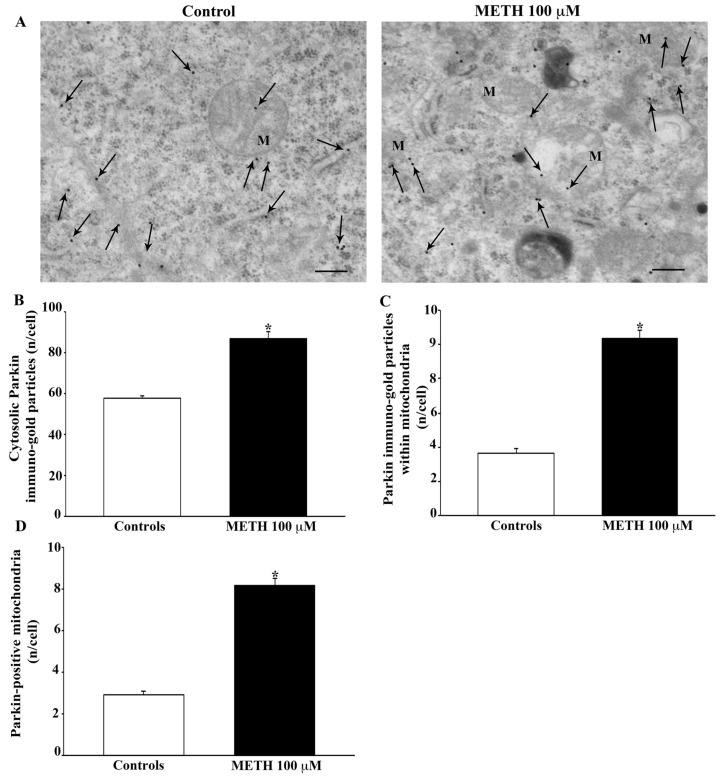
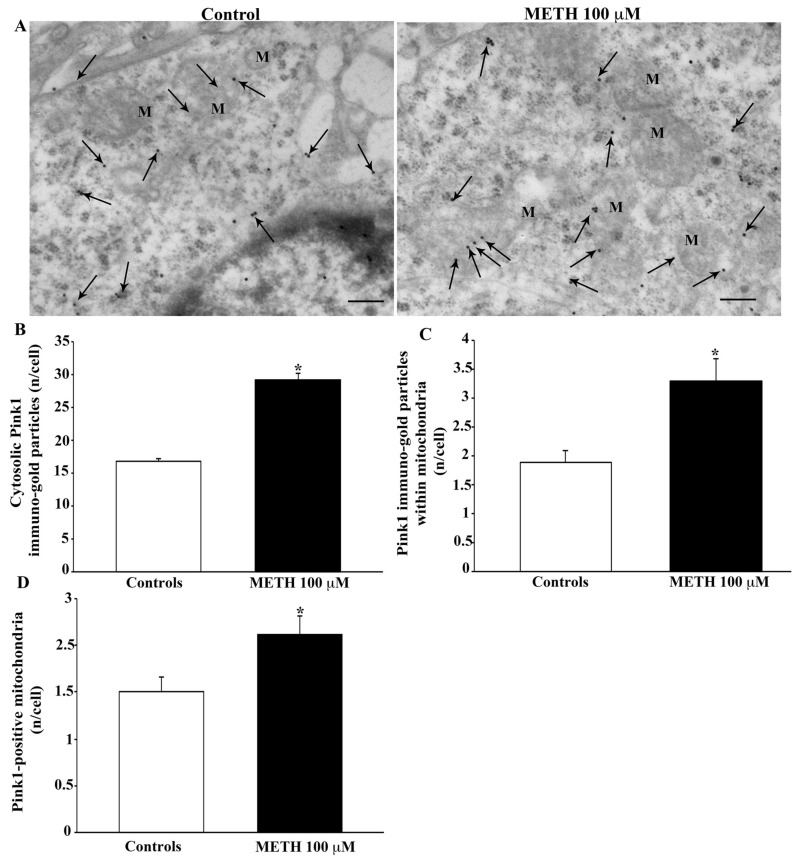
Recent evidence shows that methamphetamine (METH) produces mitochondrial alterations that contribute to neurotoxicity. Nonetheless, most of these studies focus on mitochondrial activity, whereas mitochondrial morphology remains poorly investigated. In fact, morphological evidence about the fine structure of mitochondria during METH toxicity is not available. Thus, in the present study we analyzed dose-dependent mitochondrial structural alterations during METH exposure. Light and transmission electron microscopy were used, along with ultrastructural stoichiometry of catecholamine cells following various doses of METH. In the first part of the study cell death and cell degeneration were assessed and they were correlated with mitochondrial alterations observed using light microscopy. In the second part of the study, ultrastructural evidence of specific mitochondrial alterations of crests, inner and outer membranes and matrix were quantified, along with in situ alterations of mitochondrial proteins. Neurodegeneration induced by METH correlates significantly with specific mitochondrial damage, which allows definition of a scoring system for mitochondrial integrity. In turn, mitochondrial alterations are concomitant with a decrease in fission/mitophagy protein Fis1 and DRP1 and an increase in Pink1 and Parkin in situ, at the mitochondrial level. These findings provide structural evidence that mitochondria represent both direct and indirect targets of METH-induced toxicity.

Keywords: DRP1; Fis1; MitoTracker; Parkin; Pink1; mitochondrial fission; mitophagy; neurotoxicity; psychostimulants; ultrastructural morphometry.


Conflict of interest statement

The authors declare no conflict of interest.

Figures

Figure 1
Figure 1
METH dose-dependently induces cell death. (A) Representative pictures of H&E-stained cells show that increasing doses of METH (from 10 μM up to 1000 μM) dose-dependently induces cell loss and morphological changes in spared cells (arrows). (B) The graph reports the percentage of cells counted after METH treatment (at doses ranging from 10 μM up to 1000 μM) compared with those counted in control conditions. Values are given as the mean percentage ± S.E.M. of cells counted from three independent experiments (assuming controls as 100%). * p ≤ 0.05 compared with controls; # p ≤ 0.05 compared with controls and METH 100 μM. Scale bar = 14 μm.
Figure 2
Figure 2
METH dose-dependently increases FJB histofluorescence and TB-positive cells. (A) Representative pictures of FJB-stained PC12 cells after treatment with increasing doses (from 10 μM up to 1000 μM) of METH show a dose-dependent increase in FJB histofluorescence induced by METH compared with controls. Arrows indicate FJB intensely positive cells. This is confirmed by the graphs shown in (B,C), which report the number of FJB-positive cells and the mean intensity of fluorescence per cell, respectively, both in control conditions and following increasing doses of METH. (D) The graph reports the count of TB-positive cells following increasing doses of METH (from 10 μM up to 1000 μM) compared with controls. Values are given as the mean ± S.E.M (B) the mean percentage ± S.E.M. (assuming controls as 100%, (C)) or the mean percentage ± S.E.M. of TB-positive cells out of the total cells (D), which were counted from three independent experiments. * p ≤ 0.05 compared with controls; # p ≤ 0.05 compared with controls and METH 10 μM. Scale bar = 14 μm.
Figure 3
Figure 3
Effect of METH on MTR-G fluorescence. (A) Representative pictures of MTR-G fluorescence, which labels total (both healthy and altered) mitochondria, show that MTR-G-positive mitochondria increase at the dose of METH 100 μM, whereas they are similar to controls following higher METH doses (i.e., 1000 μM). Arrows indicate intensely MTR-G-stained cells. This is confirmed by the graph (B), which reports the densitometry of MTR-G fluorescence. Values are given as the mean percentage ± S.E.M. of optical density (assuming controls as 100%) from three independent experiments. * p < 0.05 compared with controls; # p < 0.05 compared with all other groups. Scale bar = 11 μm.
Figure 4
Figure 4
METH dose-dependently reduces MTR-R fluorescence. MTR-R labels healthy mitochondria. (A) Representative pictures showing a dose-dependent decrease of MTR-R fluorescence for doses starting at METH 100 μM. Arrows indicate intensely MTR-R-stained cells. (B) The graph reports the mean densitometry of MTR-R fluorescence per cell. Values are given as the mean percentage ± S.E.M. of optical density (assuming controls as 100%) from three independent experiments. * p < 0.05 compared with controls. Scale bar = 11 μm.
Figure 5
Figure 5
METH-induced cell death correlates with mitochondrial alterations. (A) Representative TEM micrographs showing healthy (Control) and damaged cells following increasing doses (10 μM, 100 μM, 1000 μM) of METH. After METH treatment, nuclear condensation (#), large cytosolic vacuoles (*), altered mitochondria (arrows) and fragmentation of plasma membrane (arrowheads) are shown. (B) The graph reports the percentage of METH-induced cell death. (C) The graph reports the linear regression between the percentage of cell death and the percentage of altered mitochondria following increasing doses of METH (p = 0.04). Values are given as the mean percentage ± S.E.M. from N = 100 cells. * p ≤ 0.05 compared with controls; # p ≤ 0.05 compared with controls and METH 10 μM. Scale bars = 700 nm. N = nucleus.
Figure 6
Figure 6
METH produces dose-dependent mitochondrial alterations. (A) Representative TEM micrographs showing mitochondria (arrows) in control and after increasing doses of METH. Inserts at high magnification show details of mitochondrial ultrastructure for each experimental group, such as matrix dilution (*), broken crests (arrows) and ruptures of membranes (arrowheads). (B) The graph reports the total number of mitochondria after increasing doses of METH (from 10 μM up to 1000 μM). (C) The graph reports the dose-dependent increase in altered mitochondria following METH. Values are given either as the mean ± S.E.M (B) or as the mean percentage ± S.E.M. (C) from N = 50 cells per group. * p ≤ 0.05 compared with controls; # p ≤ 0.05 compared with controls and METH 10 μM. Scale bars = 500 nm; 280 nm (inserts).
Figure 7
Figure 7
METH modifies mitochondrial size. (A) Representative TEM micrographs showing dose-dependent mitochondrial (M) changes induced by METH. Graphs report the maximum (B), and the minimum (C) mitochondrial diameter and the mitochondrial area (D). The graph reports the linear regression (E) between the mitochondrial area and the percentage of altered mitochondria for various doses of METH (p = 0.02). Values are given as the mean ± S.E.M from N = 150 mitochondria per group. * p ≤ 0.05 compared with controls; # p ≤ 0.05 compared with controls and METH 10 μM and 100 μM. Scale bars = 160 nm.
Figure 8
Figure 8
METH decreases matrix electron-density. (A) Representative TEM micrographs showing a dose-dependent decrease in electron density of mitochondrial matrix. In control, mitochondria possess a marked electron dense matrix, whereas after increasing doses of METH (from 10 μM up to 1000 μM) the mitochondria possess a diluted matrix that appears less electron dense compared with control (*). M = mitochondria. (B) Graph reports values showing matrix dilution as a weighted measurement (percentage of matrix electron density from controls). Values are given as the percentage mean ± S.E.M from N = 150 mitochondria per group. * p ≤ 0.05 compared with controls; # p ≤ 0.05 compared with controls and METH 10 μM and 100 μM. Scale bars = 160 nm.
Figure 9
Figure 9
METH breaks mitochondrial crests. (A) Representative TEM micrographs showing that METH dose-dependently increases mitochondria (M) with broken crests (arrow). (B) The graph reports mitochondria with broken crests. Values are given as the mean ± S.E.M from N = 50 cells per group. * p ≤ 0.05 compared with controls; # p ≤ 0.05 compared with controls and METH 10 μM and 100 μM. Arrows point to broken crests. Scale bars = 160 nm.
Figure 10
Figure 10
METH disrupts mitochondrial membranes. (A) Representative TEM micrographs showing that METH dose-dependently increases the ruptures of inner and outer membranes (arrowhead) of mitochondria (M). (B) The graph reports mitochondria with ruptured membranes. Values are given as the mean ± S.E.M from N = 50 cells per group. * p ≤ 0.05 compared with controls; # p ≤ 0.05 compared with controls and METH 10 μM and 100 μM. Scale bars = 160 nm.
Figure 11
Figure 11
METH decreases the mitochondrial integrity score. (A) Representative TEM micrographs showing that METH dose-dependently decreases the integrity of those features used to assess the mitochondrial integrity score. Arrows point to broken crests; arrowheads point to ruptured membranes; * indicates matrix dilution. (B) The graph reports the non-parametric mitochondrial integrity score from N = 150 mitochondria per group. Assuming the score as the sum of four non-parametric values, the parametric mean of these values is provided along with its standard error. In this way, the means are compared inferentially. * p ≤ 0.05 compared with controls; # p ≤ 0.05 compared with controls and METH 10 μM and 100 μM. Scale bars = 160 nm.
Figure 12
Figure 12
METH decreases the fission protein Fis1. (A) Representative TEM micrographs showing Fis1 particles from control and following METH 100 μM. Arrows point to Fis1 immunogold particles within cytosol and mitochondria (M). Graph (B) reports the number of Fis1 immunogold particles within the cytosol. Graph (C) reports the number of Fis1 immunogold particles within mitochondria. Graph (D) indicates the number of Fis1-positive mitochondria. Values are given as the mean ± S.E.M from N = 50 cells per group. * p ≤ 0.05 compared with controls. Scale bars = 170 μm.
Figure 13
Figure 13
METH decreases the fission protein DRP1. (A) Representative TEM micrographs showing DRP1 particles from control and following METH 100 μM. Arrows point to DRP1 immunogold particles within cytosol and mitochondria (M). Graph (B) reports the number of DRP1 immunogold particles within the cytosol. Graph (C) reports the number of DRP1 immunogold particles within mitochondria. Graph (D) indicates the number of DRP1-positive mitochondria. Values are given as the mean ± S.E.M from N = 50 cells per group. * p ≤ 0.05 compared with controls. Scale bars = 170 μm.
Figure 14
Figure 14
METH increases the protein, Parkin. (A) Representative TEM micrographs showing Parkin particles from control and following METH 100 μM. Arrows point to Parkin immunogold particles within cytosol and mitochondria (M). Graph (B) reports the number of Parkin immunogold particles within the cytosol. Graph (C) reports the number of Parkin immunogold particles within mitochondria. Graph (D) indicates the number of Parkin-positive mitochondria. Values are given as the mean ± S.E.M from N = 50 cells per group. * p ≤ 0.05 compared with controls. Scale bars = 170 μm.
Figure 15
Figure 15
METH increases the protein, Pink1. (A) Representative TEM micrographs showing Pink1 particles from control and following METH 100 μM. Arrows point to Pink1 immunogold particles within cytosol and mitochondria (M). Graph (B) reports the number of Pink1 immunogold particles within the cytosol. Graph (C) reports the number of Pink1 immunogold particles within mitochondria. Graph (D) indicates the number of Pink1-positive mitochondria. Values are given as the mean ± S.E.M from N = 50 cells per group. * p ≤ 0.05 compared with controls. Scale bars = 170 μm.

Similar articles

Cited by

References

    1. Ricaurte G.A., Guillery R.W., Seiden L.S., Schuster C.R., Moore R.Y. Dopamine nerve terminal degeneration produced by high doses of methylamphetamine in the rat brain. Brain Res. 1982;235:93–103. doi: 10.1016/0006-8993(82)90198-6. - DOI - PubMed
    1. Wilson J.M., Kalasinsky K.S., Levey A.I., Bergeron C., Reiber G., Anthony R.M., Schmunk G.A., Shannak K., Haycock J.W., Kish S.J. Striatal dopamine nerve terminal markers in human, chronic methamphetamine users. Nat. Med. 1996;2:699–703. doi: 10.1038/nm0696-699. - DOI - PubMed
    1. Moratalla R., Khairnar A., Simola N., Granado N., García-Montes J.R., Porceddu P.F., Tizabi Y., Costa G., Morelli M. Amphetamine-related drugs neurotoxicity in humans and in experimental animals: Main mechanisms. Prog. Neurobiol. 2017;155:149–170. doi: 10.1016/j.pneurobio.2015.09.011. - DOI - PubMed
    1. Jayanthi S., Daiwile A.P., Cadet J.L. Neurotoxicity of methamphetamine: Main effects and mechanisms. Exp. Neurol. 2021;344:113795. doi: 10.1016/j.expneurol.2021.113795. - DOI - PMC - PubMed
    1. Limanaqi F., Busceti C.L., Celli R., Biagioni F., Fornai F. Autophagy as a gateway for the effects of methamphetamine: From neurotransmitter release and synaptic plasticity to psychiatric and neurodegenerative disorders. Prog. Neurobiol. 2021;204:102112. doi: 10.1016/j.pneurobio.2021.102112. - DOI - PubMed

MeSH terms