. 2022 Aug 12;23(16):9033.
doi: 10.3390/ijms23169033.

Craniofacial Defects in Embryos with Homozygous Deletion of Eftud2 in Their Neural Crest Cells Are Not Rescued by Trp53 Deletion

Affiliations

Craniofacial Defects in Embryos with Homozygous Deletion of Eftud2 in Their Neural Crest Cells Are Not Rescued by Trp53 Deletion

Marie-Claude Beauchamp et al. Int J Mol Sci. .

Abstract

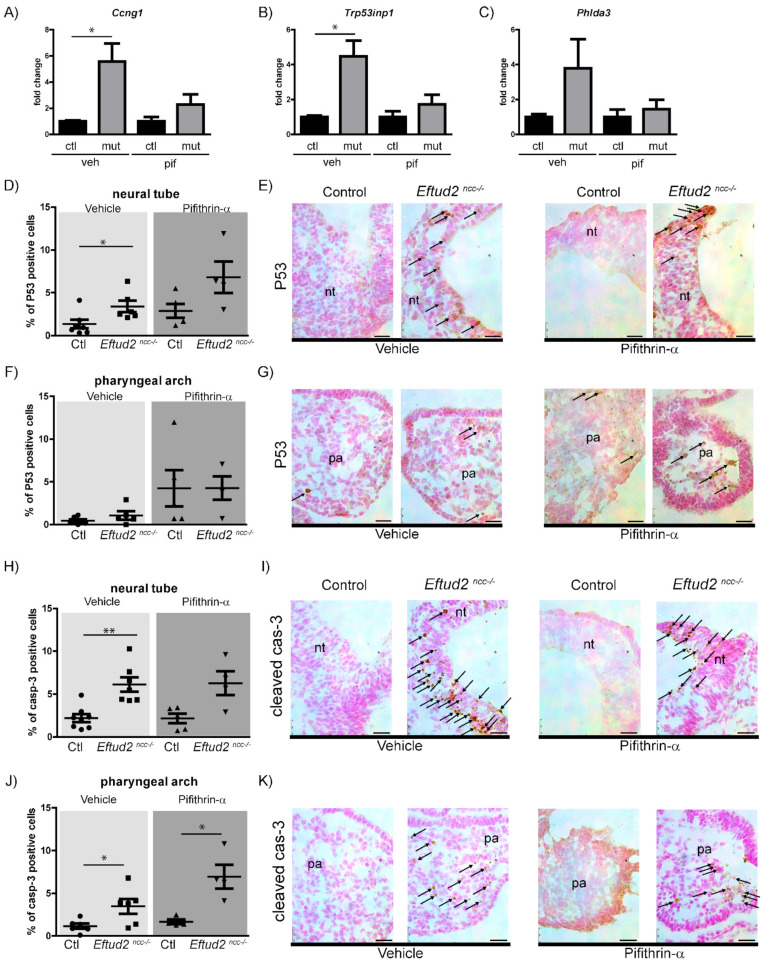
Embryos with homozygous mutation of Eftud2 in their neural crest cells (Eftud2ncc-/-) have brain and craniofacial malformations, hyperactivation of the P53-pathway and die before birth. Treatment of Eftud2ncc-/- embryos with pifithrin-α, a P53-inhibitor, partly improved brain and craniofacial development. To uncover if craniofacial malformations and death were indeed due to P53 hyperactivation we generated embryos with homozygous loss of function mutations in both Eftud2 and Trp53 in the neural crest cells. We evaluated the molecular mechanism underlying craniofacial development in pifithrin-α-treated embryos and in Eftud2; Trp53 double homozygous (Eftud2ncc-/-; Trp53ncc-/-) mutant embryos. Eftud2ncc-/- embryos that were treated with pifithrin-α or homozygous mutant for Trp53 in their neural crest cells showed reduced apoptosis in their neural tube and reduced P53-target activity. Furthermore, although the number of SOX10 positive cranial neural crest cells was increased in embryonic day (E) 9.0 Eftud2ncc-/-; Trp53ncc-/- embryos compared to Eftud2ncc-/- mutants, brain and craniofacial development, and survival were not improved in double mutant embryos. Furthermore, mis-splicing of both P53-regulated transcripts, Mdm2 and Foxm1, and a P53-independent transcript, Synj2bp, was increased in the head of Eftud2ncc-/-; Trp53ncc-/- embryos. While levels of Zmat3, a P53- regulated splicing factor, was similar to those of wild-type. Altogether, our data indicate that both P53-regulated and P53-independent pathways contribute to craniofacial malformations and death of Eftud2ncc-/- embryos.

Keywords: Eftud2; MFDM; P53; craniofacial; neural crest cells; neurocristopathies; spliceosomopathies; splicing.


Conflict of interest statement

The authors declare no competing interest.

Figures

Figure 1
Figure 1
Treatment of Eftud2ncc−/− embryos with pifithrin-α from E6.5–E8.5 reduces P53-activity, nuclear P53 accumulation, and apoptosis. (AC) RT-qPCR analysis revealed significant increases in the levels of (A) Ccng1 and (B) Trp53inp1, and a non-significant increase in the level of (C) Phlda3 in the heads of Eftud2ncc−/− embryos (mut, n = 3) treated with vehicle (veh), when compared to the controls (ctl, n = 3). In pifithrin-α (pif)-treated mutants (mut. n = 6), levels of these genes are similar to the controls (ctl, n = 4). The Y-axis indicates fold change over the control, the error bars represent SEM, * p < 0.05 by t-test. (D,F) Quantification of nuclear P53-positive cells in the neural tube (D) and first pharyngeal arch (F) of the vehicle and the pifithrin-α treated control (n = 7 veh, n = 5, pif) and Eftud2ncc−/− embryos (n = 6 veh, n = 4, pif). The percentage of P53-positive nuclei was significantly increased in the neural tube of the vehicle treated mutant embryos when compared to the controls. Each dot represents the average percentage of positive cells in a single embryo (* p < 0.01 by t-test). (E,G) Representative images of P53 nuclear staining in vehicle (left) or pifithrin-α (right)-treated embryos. Sections were counterstained with nuclear fast red (red), P53-staining is in brown. The arrows indicate P53 positive cells. (H) Quantification of cleaved caspase-3-positive cells showing significant increase in the percentage of apoptotic cells in the neural tube of vehicle-treated Eftud2ncc−/− embryos (n = 7) and (J) in the first pharyngeal arch of pifithrin-α-treated Eftud2ncc−/− embryos (n = 4), when compared to the control (n = 5, veh, n = 5, pif). Each dot represents the average percentage of positive cells in a single embryo (* p < 0.05, ** p < 0.01 by t-test). (I,K) Representative images of cleaved Caspase-3 staining of vehicle or pifithrin-α treated embryos. Arrows indicate cleaved Caspase-3 positive cells. (Genotypes of the control embryos included Eftud2loxp/− or Eftud2loxp/+). Scale bar = 25 µm. nt = neural tube, pa = pharyngeal arch.
Figure 2
Figure 2
Eftud2ncc−/−; Trp53ncc−/− embryos have decreased P53 activity and apoptosis at E10.5. (A) RT-qPCR analysis showed that levels of Ccng1, Trp53inp1 and Phlda3 were significantly increased in the heads of Eftud2ncc−/− embryos when compared to controls or Eftud2ncc−/−; Trp53ncc−/− mutants. Controls (ctl; n = 4), Eftud2ncc−/− (n = 4) and Eftud2ncc−/−; Trp53ncc−/− (n = 6). The Errors bars represent SEM. (B) Quantification of the percentage of P53 positive cells showed an increase in the neural tube of Eftud2ncc−/− and Eftud2ncc−/−; Trp53ncc+/− mutant E10.5 embryos, compared to controls or Eftud2ncc−/−; Trp53ncc−/− mutants, (C) but not in the pharyngeal arch. Each dot represents average percentage of positive cells in an embryo. The right panels show representative images of P53 nuclear staining by immunohistochemistry. The sections were counterstained with nuclear fast red (red), P53-staining is in brown. (D) Quantification of the percentage of cleaved Caspase-3-positive cells revealed a significant increase in the neural tube of Eftud2ncc−/−; Trp53ncc+/− mutant embryos compared to controls, Eftud2ncc−/− or Eftud2ncc−/−; Trp53ncc−/− mutants, (E) but not in the pharyngeal arch. Each dot represents the average of the percentage of positive cells in an embryo. The right panels show representative images of cleaved Caspase-3-positive cells by immunohistochemistry. (ctl n = 4: genotypes of control embryos included Eftud2loxp/−; Trp53loxp/+ or Eftud2loxp/+; Trp53loxp/loxp), Eftud2ncc−/− n = 5, Eftud2ncc−/−; Trp53ncc+/− n = 4, Eftud2ncc−/−; Trp53ncc−/− n = 5). * p < 0.05, ** p < 0.01 by ANOVA. Scale bar = 25 µm. nt = neural tube, hm = head mesenchyme, pa = pharyngeal arch.
Figure 3
Figure 3
SOX10 expression is higher in Eftud2ncc−/−; Trp53ncc−/− embryos than in Eftud2ncc−/− and similar to controls, at E9.0. Representative images of the head of embryos after wholemount immunofluorescence staining with an antibody to SOX10 (red) or with DAPI (blue) in (A) control (n = 4), (B) Eftud2ncc−/−; Trp53ncc+/+ (n = 4), and (C) Eftud2ncc−/−; Trp53ncc−/− embryos (n = 4). (Genotypes of control embryos included Eftud2loxp/−; Trp53loxp/+ or Eftud2loxp/+; Trp53loxp/loxp). (A) In the control embryos, SOX10 is present in post-migratory neural crest cells in and around the eye and in the pharyngeal arches. (B) Reduced SOX10 staining is seen in Eftud2ncc−/−; Trp53ncc+/+ embryos. (C) In Eftud2ncc−/−; Trp53ncc−/− embryos staining for SOX10 is similar to that seen in controls. Scale bar = 50 µm. e = eye, pa = pharyngeal arch.
Figure 4
Figure 4
Removing Trp53 does not improve craniofacial development in Eftud2ncc−/− mutants. Representative images of control, Eftud2ncc−/−; Trp53ncc+/+, Eftud2ncc−/−; Trp53ncc+/− and Eftud2ncc−/−; Trp53ncc−/− embryos collected at (A) E9.5 and (B) E10.5 showing the reduced size of the midbrain and the pharyngeal arches. (C) The head of mutant embryos have an abnormal curvature; the mandible is reduced and the maxilla and the frontonasal process (stars) was missing in all E11.5 mutant embryos. (D) Representative images of E14.5 embryos (E) stained with Alcian blue for cartilage analysis showing a hypoplastic (Meckel’s cartilage) and absent cartilage structures in the head of mutants. Scale bar = 500 µm. ov = otic vesicle, mb = midbrain, pa = pharyngeal arch, e = eye, fb = forebrain, np = nasal process, mx = maxillary, md = mandible, l = limb, ea = ear, n = nose, M = Meckel’s cartilage, At = atlas, Ax = axis.
Figure 5
Figure 5
Removing Trp53 does not improve midbrain and pharyngeal arch growth or improve survival of Eftud2ncc−/− mutant embryos. Graphs showing that the perimeter of the first pharyngeal arch (PA) was significantly reduced in Eftud2ncc−/−; Trp53ncc+/+ (n = 9, E9.5, n = 8, E10.5), Eftud2ncc−/−; Trp53ncc+/− (n = 6, E9.5, n = 7, E10.5) and Eftud2ncc−/−; Trp53ncc−/− (n = 5, E9.5, n = 13, E10.5) embryos at (A) E9.5 and (C) E10.5 when compared to controls (n = 12, E9.5, n = 10, E10.5). Graphs showing that the length of the midbrain was reduced in Eftud2ncc−/−; Trp53ncc+/+ and Eftud2ncc−/−; Trp53ncc+/− embryos compared to controls (B) at E9.5 (D) and also in Eftud2ncc−/−; Trp53ncc−/− embryos at E10.5 when compared to controls. * p < 0.05, ** p < 0.01, *** p < 0.001 vs. control by ANOVA. Contingency graphs showing a similar proportion of normal, abnormal and dead or resorbed (res) embryos at (E) E11.5 and (F) E14.5 within each of these groups: controls (n = 11, E11.5, n = 15, E14.5), Eftud2ncc−/−; Trp53ncc+/+ (n = 11, E11.5, n = 16, E14.5), Eftud2ncc−/−; Trp53ncc+/− (n = 8, E11.5, n = 16, E14.5), and Eftud2ncc−/−; Trp53ncc−/− (n = 8, E11.5, n = 2, E14.5).
Figure 6
Figure 6
Mis-splicing is increased in Eftud2ncc−/−; Trp53ncc−/− embryos. Quantification of the ratio of the skipped-exon containing transcripts vs. the full-length transcripts (FL) (left) and the representative images of gels from RT-PCR analysis (right) showing increased transcripts without (A) exon7 of FoxM1 (controls (n = 3), Eftud2ncc−/−; Trp53ncc+/+ (n = 3), Eftud2ncc−/−; Trp53ncc+/− (n = 4) and Eftud2ncc−/−; Trp53ncc−/− (n = 4)), (B) exon3 of Mdm2; (controls (n = 3), Eftud2ncc−/−; Trp53ncc+/+ (n = 4), Eftud2ncc−/−; Trp53ncc+/− (n = 4) and Eftud2ncc−/−; Trp53ncc−/− (n = 5)) and (C) exon2 of Synj2bp (controls (n = 8), Eftud2ncc−/−; Trp53ncc+/+ (n = 3), Eftud2ncc−/−; Trp53ncc+/− (n = 4), and Eftud2ncc−/−; Trp53ncc−/− (n = 5)) in Eftud2ncc−/−; Trp53ncc+/− and Eftud2ncc−/−; Trp53ncc−/− E9.5 embryos compared to controls or Eftud2ncc−/−; Trp53ncc+/+. ** p < 0.01, *** p < 0.001 vs. control, ## p < 0.01 vs. Eftud2ncc−/− by ANOVA. (D) RT-qPCR analysis expressed as fold change over control levels showing increased expression of Zmat3 in the heads of Eftud2ncc−/−; Trp53ncc+/+ (n = 3) embryos compared to controls (n = 6) or Eftud2ncc−/−; Trp53ncc−/− (n = 5) mutants at E9.5 and (E) at E10.5. Controls (n = 4), Eftud2ncc−/−; Trp53ncc+/+ (n = 4), and Eftud2ncc−/−; Trp53ncc−/− (n = 6). (Genotypes of the control embryos at E9.5 included Eftud2loxp/−; Trp53loxp/loxp or Eftud2loxp/+, and at E10.5: Eftud2loxp/+). The errors bars represent SEM. * p < 0.05 by ANOVA.

References

    1. Frazer L.N., Nancollis V., O’Keefe R.T. The role of Snu114p during pre-mRNA splicing. Pt 3Biochem. Soc. Trans. 2008;36:551–553. doi: 10.1042/BST0360551. - DOI - PubMed
    1. Huang D.W., Sherman B.T., Tan Q., Collins J.R., Alvord W.G., Roayaei J., Stephens R., Baseler M.W., Lane H.C., Lempicki R.A. The DAVID Gene Functional Classification Tool: A novel biological module-centric algorithm to functionally analyze large gene lists. Genome Biol. 2007;8:R183. doi: 10.1186/gb-2007-8-9-r183. - DOI - PMC - PubMed
    1. Beauchamp M.C., Djedid A., Daupin K., Clokie K., Kumar S., Majewski J., Jerome-Majewska L.A. Loss of function mutation of Eftud2, the gene responsible for mandibulofacial dysostosis with microcephaly (MFDM), leads to pre-implantation arrest in mouse. PLoS ONE. 2019;14:e0219280. doi: 10.1371/journal.pone.0219280. - DOI - PMC - PubMed
    1. Beauchamp M.C., Djedid A., Bareke E., Merkuri F., Aber R., Tam A.S., Lines M.A., Boycott K.M., Stirling P.C., Fish J.L., et al. Mutation in Eftud2 causes craniofacial defects in mice via mis-splicing of Mdm2 and increased P53. Hum. Mol. Genet. 2021;30:739–757. doi: 10.1093/hmg/ddab051. - DOI - PMC - PubMed
    1. Marino S., Vooijs M., van Der Gulden H., Jonkers J., Berns A. Induction of medulloblastomas in p53-null mutant mice by somatic inactivation of Rb in the external granular layer cells of the cerebellum. Genes Dev. 2000;14:994–1004. doi: 10.1101/gad.14.8.994. - DOI - PMC - PubMed

MeSH terms

Substances