. 2022 Aug 13;23(16):9056.
doi: 10.3390/ijms23169056.

Antitumor Effects of a New Retinoate of the Fungal Cytotoxin Illudin M in Brain Tumor Models

Affiliations

Antitumor Effects of a New Retinoate of the Fungal Cytotoxin Illudin M in Brain Tumor Models

Benedikt Linder et al. Int J Mol Sci. .

Abstract

While the fungal metabolite illudin M (1) is indiscriminately cytotoxic in cancer and non-malignant cells, its retinoate 2 showed a greater selectivity for the former, especially in a cerebral context. Illudin M killed malignant glioma cells as well as primary neurons and astrocytes at similarly low concentrations and destroyed their microtubule and glial fibrillary acidic protein (GFAP) networks. In contrast, the ester 2 was distinctly more cytotoxic in highly dedifferentiated U87 glioma cells than in neurons, which were even stimulated to enhanced growth. This was also observed in co-cultures of neurons with U87 cells where conjugate 2 eventually killed them by induction of differentiation based on the activation of nuclear receptors, which bind to retinoid-responsive elements (RARE). Hence, illudin M retinoate 2 appears to be a promising drug candidate.

Keywords: anticancer agents; brain tumors; illudin M; neuronal cells; retinoic acid.


Conflict of interest statement

The authors declare no conflict of interest.

Figures
Scheme 1
Scheme 1
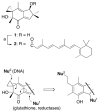
Synthesis of the retinoate 2 of illudin M (1) and mechanism of action. Reagents and conditions: (a) retinoic acid, C6H2Cl3COCl, DMF, NEt3, then 1, DMAP, toluene, 16 h, r.t., 41%.
Figure 1
Figure 1
Time-resolved measurement of the absorption at 340 nm (enone group) of 200 µM 1, 2 or solvent (DMSO) mixed with 6.5 mM glutathione in phosphate-buffered saline (PBS). Data are means ± SD of at least four independent measurements every 30 s.
Figure 2
Figure 2
F9 RARE-lacZ reporter cells show concentration-dependent activation upon treatment with 2 for 20 h. Top: bright-field images of cells treated with 2 ((a): 0 µM, (b): 0.3 µM, (c): 0.6 µM, (d): 1.3 µM, (e): 2.5 µM, (f): 5.0 µM), and β-galactosidase activity was visualized by X-Gal staining (scale bar: 100 µm). Bottom: densitometric image analyses (mean ± SD); a greater gray value means stronger RARE binding. The threshold lines at 45 and 175 represent the control and the effect of 10 nM all-trans retinoic acid. * p < 0.001, Student’s t test, groups treated with 2 were compared to control, n = 5.
Figure 3
Figure 3
Upper row: NE-4C neural stem cells differentiate to neurons upon treatment with 10 nM of all-trans retinoic acid (RA). Bottom row: retinoate 2 (10 nM) did not elicit differentiation of NE-4C stem cells. Right column shows immunohistographs after staining for neuron specific ß-tubulin III (green) and for nuclei with DAPI (blue). Scale bar: 50 µm.
Figure 4
Figure 4
Immunostaining of primary neurons derived from E14, 5 forebrains treated with 1 µM of 1, 2 or all-trans retinoic acid (RA) plus 1. Blue: nuclei stained with DAPI; green: tubulin stained with βIII-tubulin specific antibody; red: GFAP stained with α-GFAP antibody. Fluorescence microscope Zeiss Axiovert 200 M, 63× objective, 1024 × 1024 res. Scale bar: 50 µm.
Figure 5
Figure 5
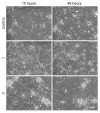
Micrographs of cultures of mouse embryonal neuronal cells untreated (control) or treated with 1 µM of 2; DIV, days in vitro. Scale bar: 100 µm.
Figure 6
Figure 6
U87 glioma cells undergo apoptosis upon 48 h treatment with 10 µM of 2. Cells in the early stages of apoptosis show calcein (green)/Annexin V-Cy3 (red) double labeling. Scale bars: 50 µm; 20 µm for inserts.
Figure 7
Figure 7
(AD). Annexin V/PI flow cytometry of MZ–54 cells upon treatment with 1 or 2, mean + SEM; Brown–Forsythe ANOVA test with Dunnett’s T3 multiple comparison test (compared with DMSO control); * < 0.05; ** < 0.01; *** < 0.001; **** < 0.0001.
Figure 8
Figure 8
Co-culture of neuronal cells and U87 glioma cells in the absence or presence of 1 µM of 1 or 2. The neuronal aggregates are marked by arrowheads. Scale bar: 100 µm.
Figure 9
Figure 9
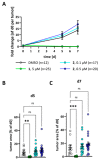
Ex vivo tumor growth assay using organotypic brain slice cultures in the absence (DMSO) or presence of 5 µM of 1 or 2. (A) Growth curves of the NCH644GFP+ tumors over time after treatment with solvent (DMSO, black line) or 5 µM 1 (green line) or 2 (blue line) normalized to the tumor size one day after transplantation (d0) depicted as mean +/− SEM. (B,C) Point plots of the data summarized in (A) after treatment for (B) 5 days or (C) 7 days). Dashed line on y = 1 display the original tumor size. ***: p < 0.001; ****: p < 0.0001; two-Way ANOVA with Tukey’s multiple comparisons test (GraphPad Prism 7).
Figure 10
Figure 10
Ex vivo tumor growth assay using organotypic brain slice cultures in the absence (DMSO) or presence of 5 µM of 1 or 0.1 µM or 0.5 µM 2. (A) Growth curves of the NCH644GFP+ tumors over time after treatment with solvent (DMSO, black line) or 5 µM 1 (green line), 0.1 µM (light blue line) or 0.5 µM 2 (blue line) normalized to the tumor size one day after transplantation (d0) depicted as mean +/− SEM. (B,C) Point plots of the data summarized in (A) after treatment for (B) 5 days or (C) 7 days). Dashed line on y = 1 display the original tumor size. **: p < 0.001; ***: p < 0.0001; two-way ANOVA with Tukey’s multiple comparisons test (GraphPad Prism 7).

References

    1. Anchel M., Hervey A., Robbins W.J. Antibiotic substances from Basidiomycetes. VII. Clitocybe illudens. Proc. Natl. Acad. Sci. USA. 1950;36:300–305. doi: 10.1073/pnas.36.5.300. - DOI - PMC - PubMed
    1. Dick R.A., Yu X., Kensler T.W. NADPH alkenal/one oxidoreductase activity determines sensitivity of cancer cells to the chemotherapeutic alkylating agent irofulven. Clin. Cancer Res. 2004;10:1492–1499. doi: 10.1158/1078-0432.CCR-03-0162. - DOI - PubMed
    1. McMorris T.C., Yu J., Lira R., Dawe R., MacDonald J.R., Waters S.J., Estes L.A., Kelner M.J. Structure-activity studies of antitumor agent irofulven (hydroxy-methylacylfulvene) and analogues. J. Org. Chem. 2001;66:6158–6163. doi: 10.1021/jo010458z. - DOI - PubMed
    1. Kelner M.J., McMorris T.C., Taetle R. Preclinical evaluation of illudins as anticancer agents: Basis for selective cytotoxicity. J. Natl. Cancer Instit. 1990;82:1562–1656. doi: 10.1093/jnci/82.19.1562. - DOI - PubMed
    1. Schobert R., Knauer S., Seibt S., Biersack B. Anticancer active illudins: Recent developments of a potent alkylating compound class. Curr. Med. Chem. 2011;18:790–807. doi: 10.2174/092986711794927766. - DOI - PubMed