. 2022 Aug 15;23(16):9124.
doi: 10.3390/ijms23169124.

High IGKC-Expressing Intratumoral Plasma Cells Predict Response to Immune Checkpoint Blockade

Affiliations

High IGKC-Expressing Intratumoral Plasma Cells Predict Response to Immune Checkpoint Blockade

Juan Luis Onieva et al. Int J Mol Sci. .

Abstract

Resistance to Immune Checkpoint Blockade (ICB) constitutes the current limiting factor for the optimal implementation of this novel therapy, which otherwise demonstrates durable responses with acceptable toxicity scores. This limitation is exacerbated by a lack of robust biomarkers. In this study, we have dissected the basal TME composition at the gene expression and cellular levels that predict response to Nivolumab and prognosis. BCR, TCR and HLA profiling were employed for further characterization of the molecular variables associated with response. The findings were validated using a single-cell RNA-seq data of metastatic melanoma patients treated with ICB, and by multispectral immunofluorescence. Finally, machine learning was employed to construct a prediction algorithm that was validated across eight metastatic melanoma cohorts treated with ICB. Using this strategy, we have unmasked a major role played by basal intratumoral Plasma cells expressing high levels of IGKC in efficacy. IGKC, differentially expressed in good responders, was also identified within the Top response-related BCR clonotypes, together with IGK variants. These results were validated at gene, cellular and protein levels; CD138+ Plasma-like and Plasma cells were more abundant in good responders and correlated with the same RNA-seq-defined fraction. Finally, we generated a 15-gene prediction model that outperformed the current reference score in eight ICB-treated metastatic melanoma cohorts. The evidenced major contribution of basal intratumoral IGKC and Plasma cells in good response and outcome in ICB in metastatic melanoma is a groundbreaking finding in the field beyond the role of T lymphocytes.

Keywords: biomarkers; immunotherapy; melanoma.


Conflict of interest statement

The authors declare no conflict of interest.

Figures

Figure 1
Figure 1
DE genes in responders of all types of melanomas and cutaneous melanomas. (a) and (c) volcano plot. The red dots depict genes that are over-expressed (x-axis positive section), or under-expressed (y-axis negative section) in responders to Nivolumab. (b,d) heatmap showing the hierarchical clustering of good and bad responders based on the expression of the DE genes. Analysis of all types of melanomas identified 22 DE genes (a,b), whereas in cutaneous melanoma, we obtained 140 DE genes (c,d). (d) Highlighted genes in bold are related to immunoglobulins and B-cell activity.
Figure 2
Figure 2
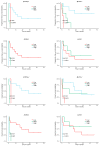
Association of the transcriptomic signature of response to Nivolumab with prognosis. Depiction of the top 8 genes with correlating expression with OS and PFS according to a stratification in low, high and medium expression (n = 16; 9 good responders, 7 bad responders).
Figure 3
Figure 3
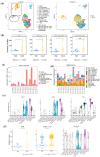
Distribution and enrichment according to response of the stromal immune cells of the single-cell RNA-seq validation cohort, estimation of the population abundance by bulk RNA-seq transcriptomic deconvolution and bulk RNA-seq gene signature mapping to single cell RNA-seq. (a) UMAP representation of the stromal cells, different types of immune cells. Each dot represents a single cell, and they are clustered and colored according to each cell type and according to the pattern of response. Increased resolution in B-cell lineage was performed to identify Naïve B cells, Naïve B cells IGK-high, Naïve B cells IGL-high, Plasma cells and Plasmablasts. (b) Comparison of the abundance among good and bad responders in B cells and the refined B-cell clusters. (c) and (d) Estimation of cell-population abundance using gene expression profile based on gene markers (c) (MCP-counter) and based on a custom signature matrix based on scRNA-seq analysis (d) (CIBERSORTx). (e) Violin plot of the gene expression in the scRNA-seq of three representative genes from our gene signature stratified by cell type validated in the scRNA-seq analysis. (f) Validation of the presence of the gene CXCR5, which is associated with tertiary lymphoid structures, in both bulk RNA-seq and scRNA-seq. CXCR5 expression distribution over cell types in scRNA-seq. In (b) p-value < 0.05 is shown as *; ns refers to non-significant.
Figure 4
Figure 4
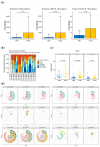
Multispectral Immunofluorescence tissue imaging of good and bad responder cases. (a,b) Fluorescence panels images of the markers CD11b, CD68, CD3, CD8, CD20, MELAN-A in (a) and CD19, CD20 and C138 in (b) of the patient IMK-20 (bad responder) and IMK-38 (good responder). (c) Boxplot with the Wilcoxon test comparing the density (Cells/mm2) between good and bad responders of CD8 and CD19.
Figure 5
Figure 5
HLA, TCR and BCR abundance and diversity is higher in good responders to Nivolumab. (a) Quantification of the sum of BCR and TCR clonotypes in good vs. bad responders and based on the stratification by type of cell. (b) Clonal proportion and diversity estimation of clonotypes. (c) Quantification of the HLA loci in good vs. bad responders based on type of HLA. (d) Representative depictions of the abundance and diversity of HLA, and the VFamily of TCR and BCR clonotypes, based on bulk RNA-seq data. Each concentric circle and color represents a variant, and the covered angle of the circumference indicates the amount of the specific variant.
Figure 6
Figure 6
BCR chain diversity among good responders. Comparison of the abundance between BCR chains in good responders.
Figure 7
Figure 7
Onco-heatmap: integration of bulk RNA-seq data, the VDJ and HLA abundance and genes features. In the upper part of the ComplexHeatmap, we represent the clinical and genomic information. The DE expressed genes in good versus bad responders are located in the center of the plot. The diversity and abundance analysis of VDJ are plotted just below the DE analysis, using a bar plot and heatmap as graphs, respectively. HLA expression is presented at the bottom of the graph. Finally, details about the differentially expressed genes can be found on the right-hand side. We depict GO information, relationship with survival and gene validation in single-cell RNA-seq cohort.
Figure 8
Figure 8
Machine-Learning-based predictive power of the transcriptomic signature. ROC curve for the (a) 140-genes model by cross-validation (CV) and (b) Random Forest (RF) model in three different external cohorts.

References

    1. Ribas A., Kefford R., Marshall M.A., Punt C.J.A., Haanen J.B., Marmol M., Garbe C., Gogas H., Schachter J., Linette G., et al. Phase III Randomized Clinical Trial Comparing Tremelimumab with Standard-of-Care Chemotherapy in Patients with Advanced Melanoma. J. Clin. Oncol. 2013;31:616–622. doi: 10.1200/JCO.2012.44.6112. - DOI - PMC - PubMed
    1. Ribas A., Puzanov I., Dummer R., Schadendorf D., Hamid O., Robert C., Hodi F.S., Schachter J., Pavlick A.C., Lewis K.D., et al. Pembrolizumab versus Investigator-Choice Chemotherapy for Ipilimumab-Refractory Melanoma (KEYNOTE-002): A Randomised, Controlled, Phase 2 Trial. Lancet Oncol. 2015;16:908–918. doi: 10.1016/S1470-2045(15)00083-2. - DOI - PMC - PubMed
    1. Larkin J., Chiarion-Sileni V., Gonzalez R., Grob J.J., Cowey C.L., Lao C.D., Schadendorf D., Dummer R., Smylie M., Rutkowski P., et al. Combined Nivolumab and Ipilimumab or Monotherapy in Untreated Melanoma. N. Engl. J. Med. 2015;373:23–34. doi: 10.1056/NEJMoa1504030. - DOI - PMC - PubMed
    1. Verma V., Sprave T., Haque W., Simone C.B., Chang J.Y., Welsh J.W., Thomas C.R. A Systematic Review of the Cost and Cost-Effectiveness Studies of Immune Checkpoint Inhibitors. J. Immunother. Cancer. 2018;6:128. doi: 10.1186/s40425-018-0442-7. - DOI - PMC - PubMed
    1. Mok T.S.K., Wu Y.L., Kudaba I., Kowalski D.M., Cho B.C., Turna H.Z., Castro G., Srimuninnimit V., Laktionov K.K., Bondarenko I., et al. Pembrolizumab versus Chemotherapy for Previously Untreated, PD-L1-Expressing, Locally Advanced or Metastatic Non-Small-Cell Lung Cancer (KEYNOTE-042): A Randomised, Open-Label, Controlled, Phase 3 Trial. Lancet. 2019;393:1819–1830. doi: 10.1016/S0140-6736(18)32409-7. - DOI - PubMed

MeSH terms