. 2022 Aug 18;23(16):9309.
doi: 10.3390/ijms23169309.

Involvement of Ferroptosis in Diabetes-Induced Liver Pathology

Affiliations

Involvement of Ferroptosis in Diabetes-Induced Liver Pathology

Ana Stancic et al. Int J Mol Sci. .

Abstract

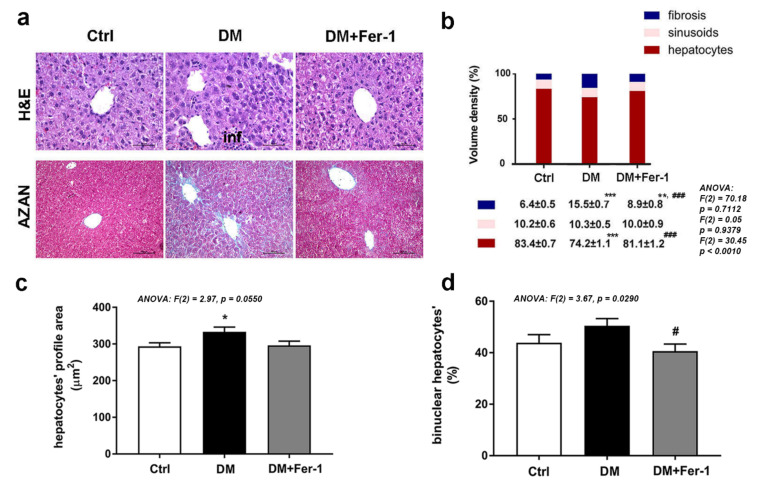
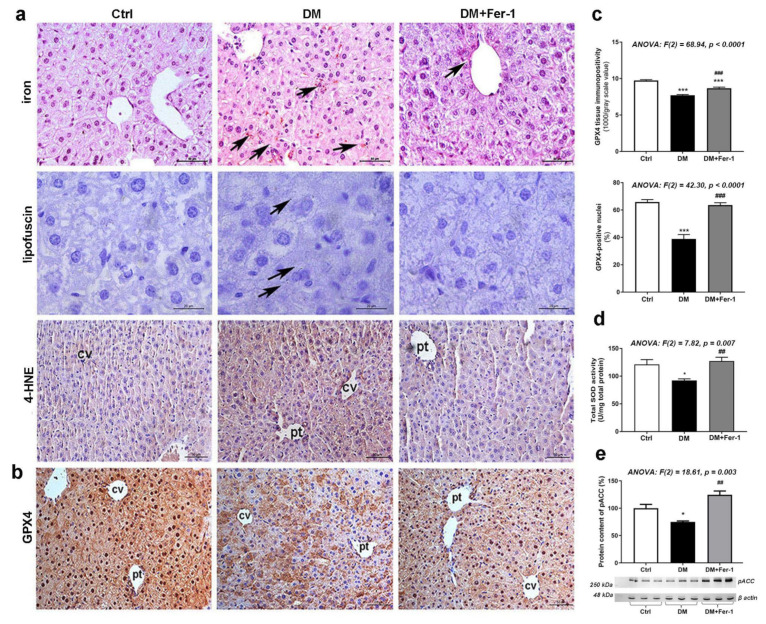
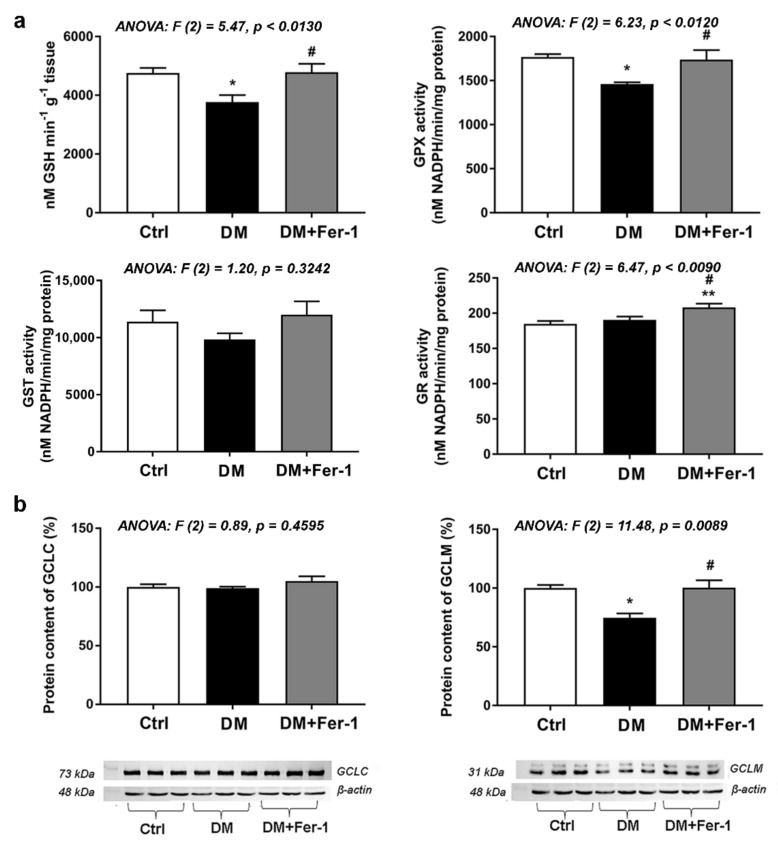
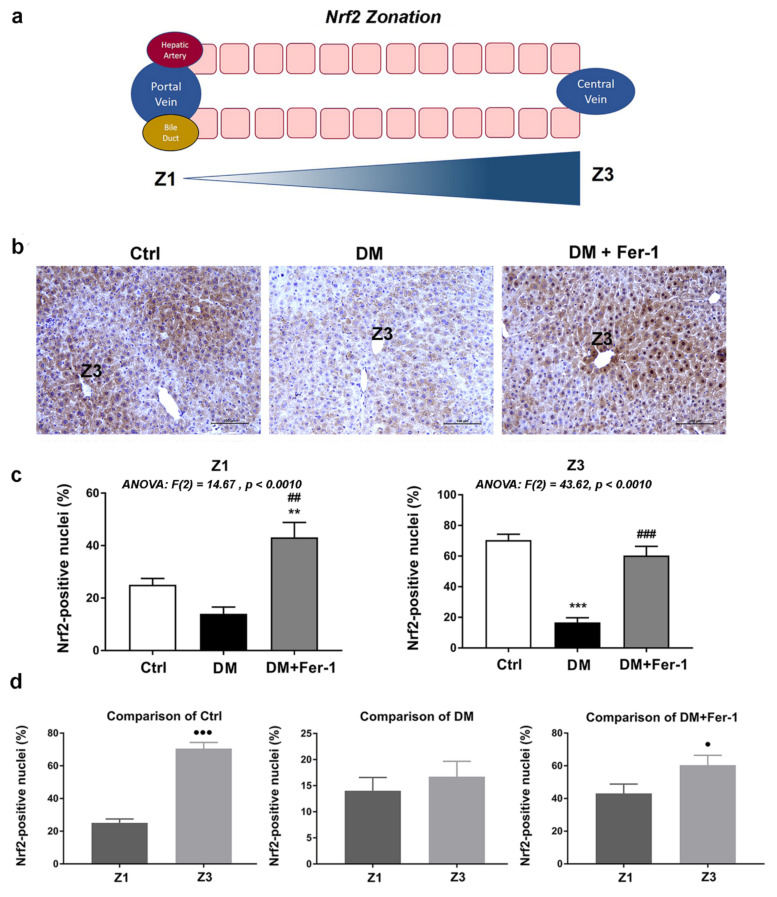
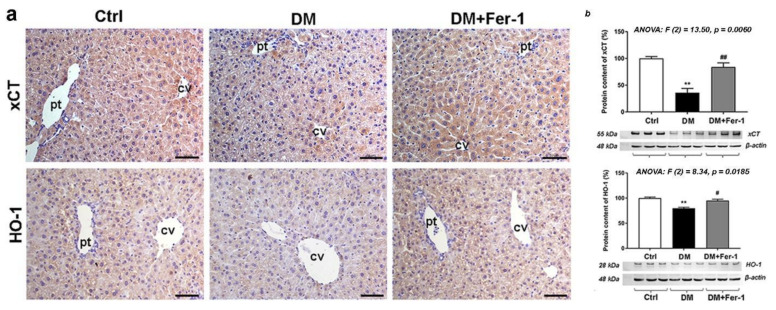
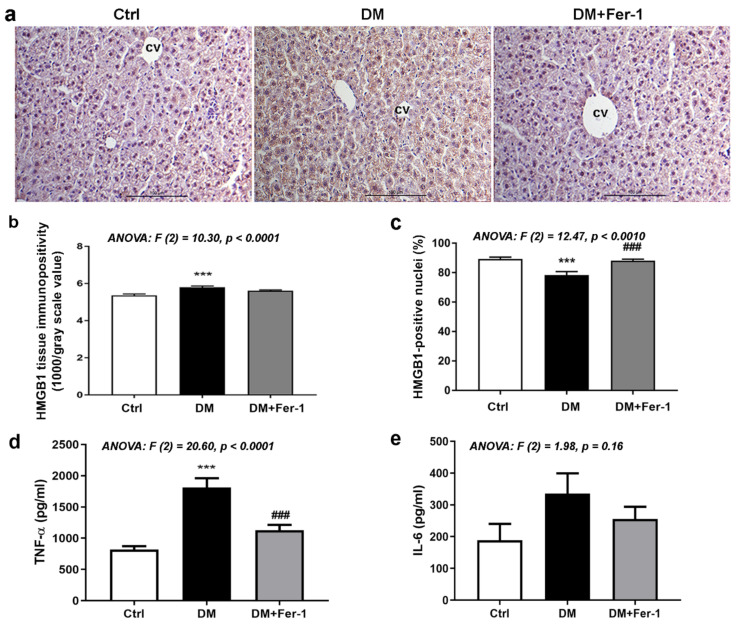
Cell death plays an important role in diabetes-induced liver dysfunction. Ferroptosis is a newly defined regulated cell death caused by iron-dependent lipid peroxidation. Our previous studies have shown that high glucose and streptozotocin (STZ) cause β-cell death through ferroptosis and that ferrostatin-1 (Fer-1), an inhibitor of ferroptosis, improves β-cell viability, islet morphology, and function. This study was aimed to examine in vivo the involvement of ferroptosis in diabetes-related pathological changes in the liver. For this purpose, male C57BL/6 mice, in which diabetes was induced with STZ (40 mg/kg/5 consecutive days), were treated with Fer-1 (1 mg/kg, from day 1-21 day). It was found that in diabetic mice Fer-1 improved serum levels of ALT and triglycerides and decreased liver fibrosis, hepatocytes size, and binucleation. This improvement was due to the Fer-1-induced attenuation of ferroptotic events in the liver of diabetic mice, such as accumulation of pro-oxidative parameters (iron, lipofuscin, 4-HNE), decrease in expression level/activity of antioxidative defense-related molecules (GPX4, Nrf2, xCT, GSH, GCL, HO-1, SOD), and HMGB1 translocation from nucleus into cytosol. We concluded that ferroptosis contributes to diabetes-related pathological changes in the liver and that the targeting of ferroptosis represents a promising approach in the management of diabetes-induced liver injury.

Keywords: Nrf2; diabetes; ferroptosis; lipid peroxidation; liver; oxidative stress.


Conflict of interest statement

The authors declare no conflict of interest.

Figures

Figure 1
Figure 1
Microscopic analysis of liver tissue of control (Ctrl), diabetic (DM), and diabetic Fer-1-treated (DM + Fer-1) animals. (a) Hematoxylin and eosin (H&E) and AZAN trichrome staining; scale bars: H&E—50 µm, AZAN—100 µm, inf—infiltration. (b) Volume density of hepatocytes, sinusoids, and fibrosis. (c) Hepatocytes profile area. (d) Proportion of binuclear hepatocytes. Values presented as means ± SEM. Statistical significance: compared with the Ctrl group (*), * p < 0.05, ** p < 0.01; *** p < 0.001; DM vs. DM + Fer-1 comparison (#), # p < 0.05; ### p < 0.001.
Figure 2
Figure 2
Lipid peroxidation-related and antioxidative parameters in liver tissue in control (Ctrl), diabetic (DM), and diabetic Fer-1-treated (DM + Fer-1) animals. (a) DAB-enhanced Pearls’ iron staining demonstration of ferrous ions accumulation (arrows); Sudan III stain-detected lipofuscin (arrows) and immunohistochemical detection of 4-HNE; scale bars: iron and 4-HNE—50 µm, lipofuscin—20 µm. (b) Immunohistochemical detection of GPX4; scale bars: 50 µm and (c) quantification of tissue and nuclear GPX4 immunopositivity; cv—centrilobular vein, pv—portal vein. (d) Total SOD activity. (e) Protein content of pACC; β-actin serves as a protein-loading control; blots represent three independent experiments. Values presented as means ± SEM. Statistical significance: compared with the Ctrl group (*), * p < 0.05, *** p < 0.001; DM vs. DM + Fer-1 comparison (#), ## p < 0.01; ### p < 0.001.
Figure 3
Figure 3
GSH and GSH-related enzymes in the liver of control (Ctrl), diabetic (DM), and diabetic Fer-1-treated (DM + Fer-1) animals. (a) Content of GSH and activities of GPX, GST, and GR. (b) Protein content of GCLC and GCLM; β-actin serves as a protein-loading control; blots represent three independent experiments. Values presented as means ± SEM. Statistical significance: compared with the Ctrl group (*), * p < 0.05, ** p < 0.01; DM vs. DM + Fer-1 comparison (#), # p < 0.05.
Figure 4
Figure 4
Immunohistochemistry of Nrf2 in liver tissue of control (Ctrl), diabetic (DM), and diabetic Fer-1-treated (DM + Fer-1) animals. (a) Schematic overview of structural zonation of the liver. (b) Immunohistochemical detection of Nrf2 expression across the liver zones; scale bars—50 µm. (c) Proportion of Nrf2 positive nuclei between the groups in Z1 and Z3. (d) Proportion of Nrf2 positive nuclei between the zones in control, DM, and DM + Fer-1 groups. Values presented as means ± SEM. Statistical significance: compared with the Ctrl group (*), ** p < 0.01; *** p < 0.001; DM vs. DM + Fer-1 comparison (#), ## p < 0.01; ### p < 0.001. Z1 vs. Z3 comparison (), p < 0.05, ●●● p < 0.001.
Figure 5
Figure 5
Detection of xCT and HO-1 (a) immunohistochemical localization and (b) protein expression in the liver tissue of control (Ctrl), diabetic (DM), and diabetic Fer-1-treated (DM + Fer-1) animals. Scale bars: 50 μm; cv—centrilobular vein, pv—portal vein. Values presented as means ± SEM. Statistical significance: compared with the Ctrl group (*), ** p < 0.01. DM vs. DM + Fer-1 comparison (#), # p < 0.05, ## p < 0.01.
Figure 6
Figure 6
HMGB1, TNF-α, and IL-6 in liver tissue of control (Ctrl), diabetic (DM), and diabetic Fer-1-treated (DM + Fer-1) animals. (a) Immunohistochemical detection of HMGB1; scale bars—50 µm. (b) Quantification of tissue and (c) nuclear immunopositivity of HMGB1. Protein level of TNF-α (d) and IL-6 (e) measured by ELISA. Values presented as means ± SEM. Statistical significance: compared with the Ctrl group (*), *** p < 0.001. DM vs. DM + Fer-1 comparison (#), ### p < 0.001.

References

    1. Bell D.S., Allbright E. The multifaceted associations of hepatobiliary disease and diabetes. Endocr. Pract. Off. J. Am. Coll. Endocrinol. Am. Assoc. Clin. Endocrinol. 2007;13:300–312. doi: 10.4158/EP.13.3.300. - DOI - PubMed
    1. Mohamed J., Nazratun Nafizah A.H., Zariyantey A.H., Budin S.B. Mechanisms of diabetes-induced liver damage: The role of oxidative stress and inflammation. Sultan Qaboos Univ. Med. J. 2016;16:e132–e141. doi: 10.18295/squmj.2016.16.02.002. - DOI - PMC - PubMed
    1. Marangiello R., Giorgetti R. A case of glycogenosis in a patient with insulin dependent diabetes. Minerva Pediatrica. 1996;48:279–281. - PubMed
    1. Chatila R., West A.B. Hepatomegaly and abnormal liver tests due to glycogenosis in adults with diabetes. Medicine. 1996;75:327–333. doi: 10.1097/00005792-199611000-00003. - DOI - PubMed
    1. Luedde T., Kaplowitz N., Schwabe R.F. Cell death and cell death responses in liver disease: Mechanisms and clinical relevance. Gastroenterology. 2014;147:765–783.e764. doi: 10.1053/j.gastro.2014.07.018. - DOI - PMC - PubMed

LinkOut - more resources