Review
. 2022 Aug 19;23(16):9341.
doi: 10.3390/ijms23169341.

Cyclophilin A/CD147 Interaction: A Promising Target for Anticancer Therapy

Affiliations
Review

Cyclophilin A/CD147 Interaction: A Promising Target for Anticancer Therapy

Jang Mi Han et al. Int J Mol Sci. .

Abstract

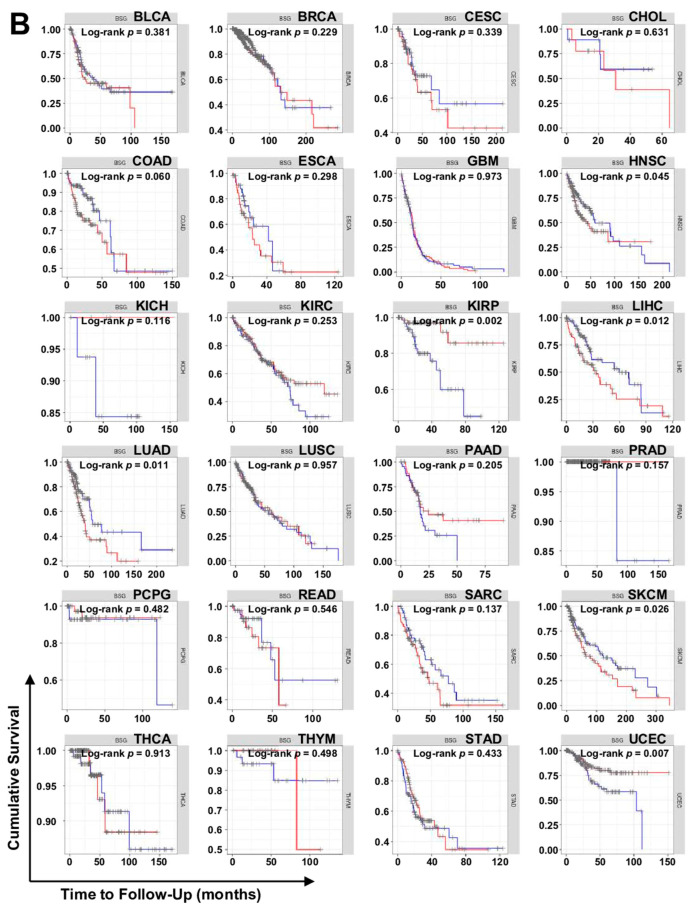
Cyclophilin A (CypA), which has peptidyl-prolyl cis-trans isomerase (PPIase) activity, regulates multiple functions of cells by binding to its extracellular receptor CD147. The CypA/CD147 interaction plays a crucial role in the progression of several diseases, including inflammatory diseases, coronavirus infection, and cancer, by activating CD147-mediated intracellular downstream signaling pathways. Many studies have identified CypA and CD147 as potential therapeutic targets for cancer. Their overexpression promotes growth, metastasis, therapeutic resistance, and the stem-like properties of cancer cells and is related to the poor prognosis of patients with cancer. This review aims to understand the biology and interaction of CypA and CD147 and to review the roles of the CypA/CD147 interaction in cancer pathology and the therapeutic potential of targeting the CypA/CD147 axis. To validate the clinical significance of the CypA/CD147 interaction, we analyzed the expression levels of PPIA and BSG genes encoding CypA and CD147, respectively, in a wide range of tumor types using The Cancer Genome Atlas (TCGA) database. We observed a significant association between PPIA/BSG overexpression and poor prognosis, such as a low survival rate and high cancer stage, in several tumor types. Furthermore, the expression of PPIA and BSG was positively correlated in many cancers. Therefore, this review supports the hypothesis that targeting the CypA/CD147 interaction may improve treatment outcomes for patients with cancer.

Keywords: BSG; CD147; PPIA; anticancer therapy; cyclophilin A.


Conflict of interest statement

The authors declare no conflict of interest.

Figures

Figure 1
Figure 1
Structure of CypA. (A) CypA has an 8-stranded antiparallel β-barrel structure with two α helices surrounding the barrel from either side. (B) Structure of CypA-CsA complex. CsA binds to the PPIase active site of CypA.
Figure 2
Figure 2
Structure of CD147. (A) Structure of extracellular Ig domains of CD147. (B) One monomer of CD147 is 269 amino acids (aa) in length and consists of two extracellular Ig domains, Ig1 and Ig2, a single transmembrane domain, and a short cytoplasmic domain. The extracellular region of CD147 contains three asparagine (Asn) glycosylation sites.
Figure 3
Figure 3
Interaction between CypA and CD147. CypA binds to amino acid Pro180 of CD147 and induces signal transduction through subsequent interaction with Pro211. The amino acid Glu218 of CD147 is also important for the signaling response.
Figure 4
Figure 4
Major oncogenic signaling pathways regulated by CypA/CD147 axis. CypA expression can be regulated by HIF-1α and interacts with its receptor CD147 through autocrine/paracrine extracellular secretion. The CypA/CD147 interaction can activate directly or indirectly multiple oncogenic signaling pathways, including PI3K/AKT, Wnt/β-catenin, MAPKs, STAT3, Notch, and NF-κB, thereby promoting proliferation, antiapoptosis, metastasis, angiogenesis, drug resistance, and stemness of cancer cells.
Figure 5
Figure 5
mRNA expression levels of PPIA and BSG in tumor tissues compared with normal tissues. (A) Expression levels of PPIA. (B) Expression levels of BSG. The data were obtained through UALCAN analysis using the TCGA database. BLCA, bladder carcinoma; BRCA, breast invasive carcinoma; CESC, cervical squamous cell carcinoma and endocervical adenocarcinoma; CHOL, cholangiocarcinoma; COAD, colon adenocarcinoma; ESCA, esophageal carcinoma; GBM, glioblastoma; HNSC, head and neck squamous cell carcinoma; KICH, kidney chromophobe; KIRC, kidney renal clear-cell carcinoma; KIRP, kidney renal papillary cell carcinoma; LIHC, liver hepatocellular carcinoma; LUAD, lung adenocarcinoma; LUSC, lung squamous cell carcinoma; PAAD, pancreatic adenocarcinoma; PRAD, prostate adenocarcinoma; PCPG, pheochromocytoma and paraganglioma; READ, rectal adenocarcinoma; SARC, sarcoma; SKCM, skin cutaneous melanoma; THCA, thyroid carcinoma; THYM, thymoma; STAD, stomach adenocarcinoma; UCEC, uterine corpus endometrial carcinoma.
Figure 6
Figure 6
Transcription levels of PPIA and BSG in individual cancer stages (normal, stage 1, stage 2, stage 3, stage 4). (A) Expression levels of PPIA. (B) Expression levels of BSG. The data were obtained through UALCAN analysis using the TCGA database. The full name of each carcinoma is described in the legend in Figure 5.
Figure 6
Figure 6
Transcription levels of PPIA and BSG in individual cancer stages (normal, stage 1, stage 2, stage 3, stage 4). (A) Expression levels of PPIA. (B) Expression levels of BSG. The data were obtained through UALCAN analysis using the TCGA database. The full name of each carcinoma is described in the legend in Figure 5.
Figure 7
Figure 7
Correlation of PPIA and BSG expression on patient survival. (A) Relationship of PPIA mRNA expression. (B) Relationship of BSG mRNA expression. The data were obtained through TIMER analysis using the TCGA database. The full name of each carcinoma is described in the legend in Figure 5. Red line, high (top 25% expression group); blue line, low (bottom 25% expression group).
Figure 7
Figure 7
Correlation of PPIA and BSG expression on patient survival. (A) Relationship of PPIA mRNA expression. (B) Relationship of BSG mRNA expression. The data were obtained through TIMER analysis using the TCGA database. The full name of each carcinoma is described in the legend in Figure 5. Red line, high (top 25% expression group); blue line, low (bottom 25% expression group).
Figure 8
Figure 8
Correlation between transcription levels of PPIA and BSG. The data were obtained through cBioPortal analysis using the TCGA database. The full name of each carcinoma is described in the legend in Figure 5.

Similar articles

Cited by

References

    1. Siegel R.L., Miller K.D., Fuchs H.E., Jemal A. Cancer statistics, 2022. CA Cancer J. Clin. 2022;72:7–33. - PubMed
    1. Sun Y. Translational horizons in the tumor microenvironment: Harnessing breakthroughs and targeting cures. Med. Res. Rev. 2015;35:408–436. - PMC - PubMed
    1. Batlle E., Clevers H. Cancer stem cells revisited. Nat. Med. 2017;23:1124–1134. - PubMed
    1. Reya T., Morrison S.J., Clarke M.F., Weissman I.L. Stem cells, cancer, and cancer stem cells. Nature. 2001;414:105–111. - PubMed
    1. Chen W., Dong J., Haiech J., Kilhoffer M.C., Zeniou M. Cancer stem cell quiescence and plasticity as major challenges in cancer therapy. Stem Cells Int. 2016;2016:1740936. - PMC - PubMed