

OsASR6 Enhances Salt Stress Tolerance in Rice
- PMID: 36012605
- PMCID: PMC9408961
- DOI: 10.3390/ijms23169340
OsASR6 Enhances Salt Stress Tolerance in Rice
Abstract
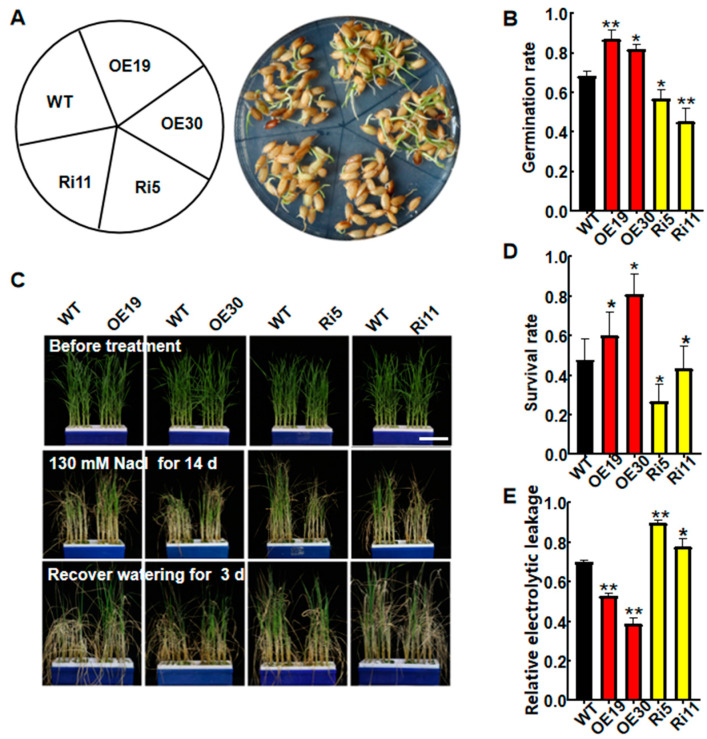
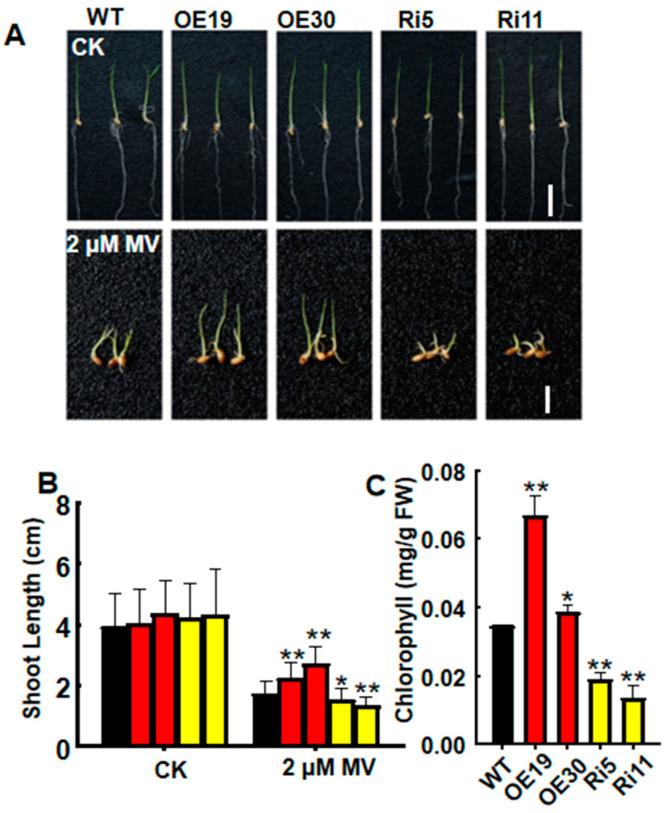
High salinity seriously affects crop growth and yield. Abscisic acid-, stress-, and ripening-induced (ASR) proteins play an important role in plant responses to multiple abiotic stresses. In this study, we identified a new salt-induced ASR gene in rice (OsASR6) and functionally characterized its role in mediating salt tolerance. Transcript levels of OsASR6 were upregulated under salinity stress, H2O2 and abscisic acid (ABA) treatments. Nuclear and cytoplasmic localization of the OsASR6 protein were confirmed. Meanwhile, a transactivation activity assay in yeast demonstrated no self-activation ability. Furthermore, transgenic rice plants overexpressing OsASR6 showed enhanced salt and oxidative stress tolerance as a result of reductions in H2O2, malondialdehyde (MDA), Na/K and relative electrolyte leakage. In contrast, OsASR6 RNAi transgenic lines showed opposite results. A higher ABA content was also measured in the OsASR6 overexpressing lines compared with the control. Moreover, OsNCED1, a key enzyme of ABA biosynthesis, was found to interact with OsASR6. Collectively, these results suggest that OsASR6 serves primarily as a functional protein, enhancing tolerance to salt stress, representing a candidate gene for genetic manipulation of new salinity-resistant lines in rice.
Keywords: Oryza sativa; OsASR6; OsNCED1; abscisic acid; salt tolerance.
Conflict of interest statement
The authors declare that they have no conflict of interest.
Figures


Similar articles
-
OsABT Is Involved in Abscisic Acid Signaling Pathway and Salt Tolerance of Roots at the Rice Seedling Stage.Int J Mol Sci. 2022 Sep 13;23(18):10656. doi: 10.3390/ijms231810656. Int J Mol Sci. 2022. PMID: 36142568 Free PMC article.
-
The suppressed expression of a stress responsive gene 'OsDSR2' enhances rice tolerance in drought and salt stress.J Plant Physiol. 2023 Mar;282:153927. doi: 10.1016/j.jplph.2023.153927. Epub 2023 Jan 19. J Plant Physiol. 2023. PMID: 36682133
-
Allantoin improves salinity tolerance in Arabidopsis and rice through synergid activation of abscisic acid and brassinosteroid biosynthesis.Plant Mol Biol. 2023 Jun;112(3):143-160. doi: 10.1007/s11103-023-01350-8. Epub 2023 May 15. Plant Mol Biol. 2023. PMID: 37184674
-
OsIAA20, an Aux/IAA protein, mediates abiotic stress tolerance in rice through an ABA pathway.Plant Sci. 2021 Jul;308:110903. doi: 10.1016/j.plantsci.2021.110903. Epub 2021 Apr 7. Plant Sci. 2021. PMID: 34034863
-
The basic helix-loop-helix transcription factor gene, OsbHLH38, plays a key role in controlling rice salt tolerance.J Integr Plant Biol. 2023 Aug;65(8):1859-1873. doi: 10.1111/jipb.13489. Epub 2023 May 10. J Integr Plant Biol. 2023. PMID: 36988217
Cited by
-
Identification of the Abscisic Acid-, Stress-, and Ripening-Induced (ASR) Family Involved in the Adaptation of Tetragonia tetragonoides (Pall.) Kuntze to Saline-Alkaline and Drought Habitats.Int J Mol Sci. 2023 Oct 31;24(21):15815. doi: 10.3390/ijms242115815. Int J Mol Sci. 2023. PMID: 37958798 Free PMC article.
-
Tissue-Specific RNA-Seq Analysis of Cotton Roots' Response to Compound Saline-Alkali Stress and the Functional Validation of the Key Gene GhERF2.Plants (Basel). 2025 Mar 1;14(5):756. doi: 10.3390/plants14050756. Plants (Basel). 2025. PMID: 40094772 Free PMC article.
-
Transcriptome and network analysis pinpoint ABA and plastid ribosomal proteins as main contributors to salinity tolerance in the rice variety, CSR28.PLoS One. 2025 Apr 17;20(4):e0321181. doi: 10.1371/journal.pone.0321181. eCollection 2025. PLoS One. 2025. PMID: 40244966 Free PMC article.
-
Zinc Oxide Nanoparticles Alleviate Salt Stress in Cotton (Gossypium hirsutum L.) by Adjusting Na+/K+ Ratio and Antioxidative Ability.Life (Basel). 2024 May 7;14(5):595. doi: 10.3390/life14050595. Life (Basel). 2024. PMID: 38792616 Free PMC article.
-
Genome-Wide Identification and Expression Profiling of ABA-Stress-Ripening (ASR) Gene Family in Barley (Hordeum vulgare L.).Plants (Basel). 2025 Mar 19;14(6):970. doi: 10.3390/plants14060970. Plants (Basel). 2025. PMID: 40265901 Free PMC article.
References
-
- Muchate N.S., Nikalje G.C., Rajurkar N.S., Suprasanna P., Nikam T.D. Plant Salt Stress: Adaptive Responses, Tolerance Mechanism and Bioengineering for Salt Tolerance. Bot. Rev. 2016;82:371–406. doi: 10.1007/s12229-016-9173-y. - DOI
-
- Hamani A.K.M., Chen J., Soothar M.K., Wang G., Shen X., Gao Y., Qiu R. Application of exogenous protectants mitigates salt-induced Na+ toxicity and sustains cotton (Gossypium hirsutum L.) seedling growth: Comparison of glycine betaine and salicylic acid. Plants. 2021;10:380. doi: 10.3390/plants10020380. - DOI - PMC - PubMed
MeSH terms
Substances
Grants and funding
LinkOut - more resources
Full Text Sources
Miscellaneous
