. 2022 Aug 4;8(8):819.
doi: 10.3390/jof8080819.

Comparative Proteomics Study on the Postharvest Senescence of Volvariella volvacea

Affiliations

Comparative Proteomics Study on the Postharvest Senescence of Volvariella volvacea

Lei Zha et al. J Fungi (Basel). .

Abstract

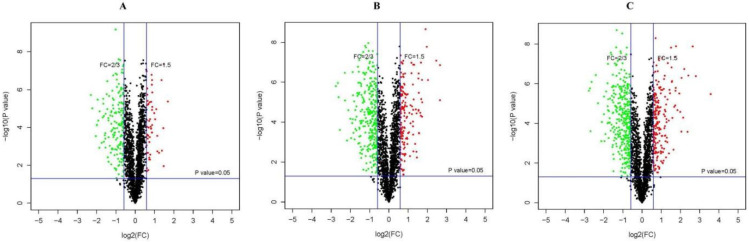
Volvariella volvacea is difficult to store after harvest, which restricts the production and circulation of V. volvacea fruiting bodies. Low-temperature storage is the traditional storage method used for most edible fungi. However, V. volvacea undergoes autolysis at low temperatures. When fruiting bodies are stored at 15 °C (suitable temperature), V. volvacea achieves the best fresh-keeping effect. However, the molecular mechanism underlying the postharvest senescence of V. volvacea remains unclear. Based on this information, we stored V. volvacea fruiting bodies at 15 °C after harvest and then analyzed the texture and phenotype combined with the results of previous physiological research. Four time points (0, 24, 60, and 96 h) were selected for the comparative proteomics study of V. volvacea during storage at 15 °C. A variety of proteins showed differential expressions in postharvest V. volvacea at 15 °C. Further comparison of the gene ontology (GO) enrichment analysis and KEGG pathways performed at different sampling points revealed proteins that were significantly enriched at several time points. At the same time, we also analyzed differentially expressed proteins (DEPs) related to the RNA transport, fatty acid biosynthesis and metabolism, and amino acid biosynthesis and metabolism pathways, and discussed the molecular functions of the PAB1, RPG1, ACC1, ADH3, ADH2, ALD5, and SDH2 proteins in postharvest V. volvacea senescence. Our results showed that many biological processes of the postharvest senescence of V. volvacea changed. Most importantly, we found that most RNA transport-related proteins were down-regulated, which may lead to a decrease in related gene regulation. Our results also showed that the expression of other important proteins, such as the fatty acid metabolism related proteins increased; and changes in fatty acid composition affected the cell membrane, which may accelerate the ripening and perception of V. volvacea fruiting bodies. Therefore, our research provides a reference for further studies on the aging mechanism of V. volvacea.

Keywords: V. volvacea; comparative proteomics; postharvest; senescence.


Conflict of interest statement

The authors have no competing financial interests or personal relationships that could have appeared to influence the work reported in this paper to declare.

Figures

Figure 1
Figure 1
Changes in the hardness (A), fracturability (B), and phenotype (C) of V. volvacea fruiting bodies during different storage periods. Each bar represents the mean ± SE of the individual samples, and * represents p < 0.05.
Figure 2
Figure 2
(AC) Volcano plots showing DEPs in V. volvacea S24–S0, S60–S0, and S96–S0. Dots highlighted in red (FC ≥ 1.5) and green (FC ≤ 2/3) indicate proteins that exhibited significantly different expression levels (p ≤ 0.05).
Figure 3
Figure 3
(AC) Venn diagrams showing the overlapping DEPs between the three V. volvacea groups (S24–S0, S60–S0, and S96–S0). The numbers of DEPs that were down-regulated (B) and up-regulated (C) at each developmental stage are shown in different circles.
Figure 4
Figure 4
Clustering analysis of V. volvacea DEPs in the S24, S60, and S96 groups compared with the S0 group. Red, green, and black indicate an increase, decrease, and no change in protein abundance, respectively, compared with the baseline level.
Figure 5
Figure 5
Bioinformatics analysis of GO terms for the aforementioned DEPs in three domains: BP, MF, and CC. The statistics at GO level 2 are shown in this figure. A: S24–S0; B: S60–S0; and C: S96–S0.
Figure 6
Figure 6
Bubble diagrams of the first 10 enriched KEGG pathways in S24–S0 (A), S60–S0 (B), and S96–S0 (C). Different numbers on the Y axis represent the following KEGG pathways: 1, RNA transport; 2, alpha-linolenic acid metabolism; 3, phenylalanine, tyrosine, and tryptophan biosynthesis; 4, valine, leucine, and isoleucine degradation; 5, mRNA surveillance; 6, ABC transporters; 7, pentose and glucuronate interconversions; 8, ether lipid metabolism; 9, nitrogen metabolism; 10, steroid biosynthesis; 11, RNA transport; 12, ribosome; 13, alpha-linolenic acid metabolism; 14, phenylalanine, tyrosine, and tryptophan biosynthesis; 15, fatty acid degradation; 16, peroxisome; 17, lysine degradation; 18, ABC transporters; 19, lysine biosynthesis; 20, biosynthesis of antibiotics; 21, alpha-linolenic acid metabolism 22, pyruvate metabolism; 23, phenylalanine, tyrosine, and tryptophan biosynthesis; 24, RNA transport; 25, fatty acid degradation; 26, peroxisome; 27, lysine biosynthesis; 28, SNARE interactions in vesicular transport; 29, fatty acid metabolism; and 30, ribosome. The rich factor represents the ratio between the DEPs and all annotated proteins enriched in the pathway. The rich factor refers to the ratio of the number of differentially expressed proteins located in the go entry to the total number of transcripts located in the go entry in all annotated proteins. The greater the rich factor, the higher the degree of enrichment. The bubble scale represents the number of DEPs, and the depth of the bubble color represents the adjusted p value.
Figure 7
Figure 7
PPI network diagram. (A): S24–S0; (B): S60–S0; and (C): S96–S0. Note: Dots represent proteins, red represents up-regulated expression, and green represents down-regulated expression. Rounded rectangles represent biological processes, cell localization, molecular functions, or signaling pathways; blue represents high significance, and yellow represents low significance. Straight lines represent the interaction relationship, the solid lines represent the relevant relationships verified in this report, and the dashed lines represent relationships unconfirmed by this experiment.
Figure 8
Figure 8
Model of V. volvacea postharvest senescence based on physiological, biochemical, and proteomic changes.

Similar articles

Cited by

References

    1. Giovannoni J. Molecular Biology of fruits Maturation and Ripening. Annu. Rev. Plant Physiol. Plant Mol. Biol. 2001;52:725–749. doi: 10.1146/annurev.arplant.52.1.725. - DOI - PubMed
    1. Paliyath G., Murr D.P., Handa A.K., Lurie S. Postharvest Biology and Technology of Fruits, Vegetables and Flowers. Wiley-Blackwell Publishing; New Delhi, India: 2008. pp. 154–196.
    1. Tian S., Qin G., Li B. Reactive oxygen species involved in regulating fruits senescence and fungal pathogenicity. Plant Mol. Biol. 2013;82:593–602. doi: 10.1007/s11103-013-0035-2. - DOI - PubMed
    1. Wu Z.L., Huang Y., Wang Z.J. Proteomic Analysis of V. volvacea in Response to Cold Stress. Food Sci. 2016;41:212–220. doi: 10.7506/spkx1002-6630-20190829-322. - DOI
    1. Zha L., Chen M.J., Yu C.X., Guo Q., Zhao X., Li Z.P., Zhao Y., Li C.H., Yang H.L. Differential proteomics study of postharvest V. volvacea during storage at 4 °C. Sci. Rep. 2020;10:31–34. doi: 10.1038/s41598-020-69988-8. - DOI - PMC - PubMed

LinkOut - more resources