. 2022 Aug 18;12(8):1262.
doi: 10.3390/life12081262.

Microbial Diversity and Community Composition of Duodenum Microbiota of High and Low Egg-Yielding Taihang Chickens Identified Using 16S rRNA Amplicon Sequencing

Affiliations

Microbial Diversity and Community Composition of Duodenum Microbiota of High and Low Egg-Yielding Taihang Chickens Identified Using 16S rRNA Amplicon Sequencing

Haiyin Han et al. Life (Basel). .

Abstract

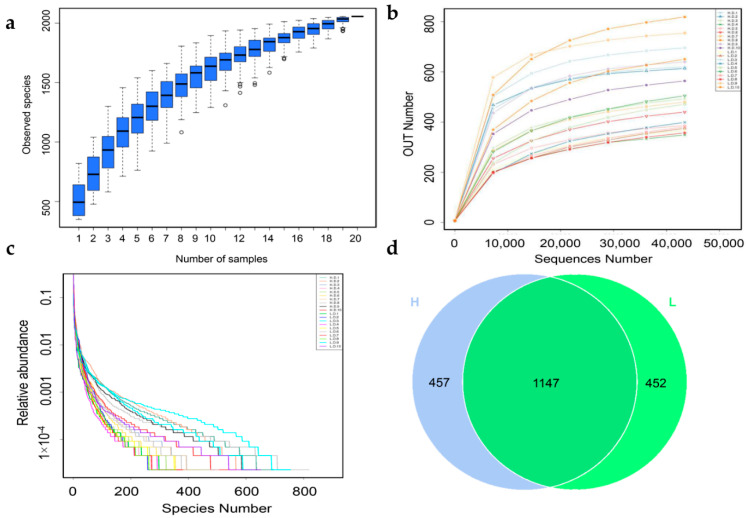
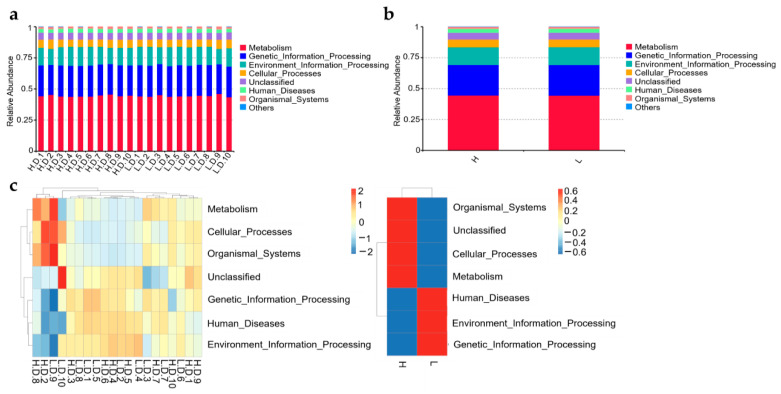
The duodenum is an important digestive organ for poultry and houses a variety of microbes that help chickens to enhance nutrient absorption and improve production. To evaluate the characteristic of gut microbiome, duodenum content samples from 42-week-old native Taihang chickens with high (H) and low (L) egg-yielding were collected for 16S rRNA amplicon sequencing analysis. Consequently, 1,361,341 sequences were clustered into 2055 OTUs, with percentages of affiliation of 96.50 and 57.30% at phylum and genus levels. Firmicutes, Proteobacteria, Cyanobacteria and Bacteroidetes were the dominant phylum, with a lower ratio of Firmicutes/Bacteroidetes in H group than in L group (p < 0.05). At genus level, overrepresentation of Bacteroides, Faecalibacterim, and Enterococcus and underrepresentation of Romboutsia were found in H group. No significant difference in overall diversity of microbiota was observed between two groups. LEFSe analysis revealed Enterococcus was significantly enriched in H group. Importantly, Enterococcus and Lactobacillus were negatively correlated. Functional prediction analysis showed the proportion of microbiota involved in the metabolism process was the highest and enriched in H group. Differences in microbiota composition between the two groups, which may be related to intestinal function difference, also provide promising biomarkers for improving laying hen production.

Keywords: Taihang chicken; bacterial diversity; egg-laying performance; function prediction; high-throughput sequencing.


Conflict of interest statement

The authors declare no conflict of interest.

Figures

Figure 1
Figure 1
Sample abundance analysis. The species accumulation boxplot (a); rarefaction curves (b); and Rank abundance curve (c) were based on the OTU number; (d) a Venn diagram of the OTUs for H and L group.
Figure 2
Figure 2
Comparative of duodenum microbiome abundance at phyla and genus level. Differences in the relative abundance of top 10 microbial phyla among samples (intragroup) (a); and between H and L groups (b); heatmap hierarchical cluster analysis based on the 35 most abundant genera among samples (intragroup) (c); and between H and L groups (d). The date represents the average percentage of all sequences that have been detected, and each bar represents the average of a sample or a group. The relative abundance was drawn intuitively from red to blue; red represented the highest abundant (max = 4), while blue (min = −4) represented the lowest abundant.
Figure 3
Figure 3
In-depth comparative analysis of genus with phylogenetic tree. Each circle on the phylogenetic tree node was scaled logarithmically to indicate the relative abundance of each genera with a pie chart distinguishing between H and L groups.
Figure 4
Figure 4
The distribution and representation of the top 100 genera. Bar charts indicated the relative abundance of the genera. The innermost clades and labels were colored by phylum.
Figure 5
Figure 5
The evaluation of microbial alpha diversity. Alpha diversity in H and L groups (n = 10 per group) was estimated using Observed species richness indices (a); and Shannon diversity indices (b); the median, quartiles, extreme values of the data were displayed on Box plots. Differences in alpha diversity were estimated with the Wilcox test, p > 0.05.
Figure 6
Figure 6
Comparative analysis of the beta diversity: (a) heatmap of Beta diversity indices. The difference coefficient between H and L groups was indicated by the number in each square. The disparity in species diversity decreased with decreasing difference coefficient. The upper and lower numbers in the same square stand for the weighted and Unweighted UniFrac distances (mean ± SEM), respectively. Principal coordinate analysis (PCoA) figure based on the weighted UniFrac distance (b); and unweighted UniFrac distance (c) was drawn; (d) principal Coordinate Analysis (PCA) showed the similarities between the two groups; and (e) the nonmetric multidimensional scaling (NMDS) analysis revealed differences in microbiome communities based on the Bray-Curtis distance. Red symbols stood for biological replicates within H group, and blue symbols within L group.
Figure 7
Figure 7
Hierarchical clustering analysis. Dendrogram of Unweighted UniFrac UPGMA cluster analysis (a) and the relative abundances of duodenal microbial phyla for all samples (b).
Figure 8
Figure 8
Statistical analysis of bacterial composition differences between groups. Beta diversity indexes of weighted (a) and unweighted (b) unifrac distance indicated the variance in the duodenal microbiota. The quartiles, median, and extreme values were displayed on the box plots. (c) Anosim analysis of Bray–Curtis distance (R = 0.016, p = 0.31) showed the difference in the microbiota communities between H and L groups. (d) Simper analysis of Bray–Curtis distance verified ten phylum with highest contributions to bacterial dissimilarity and dominance between H and L groups.
Figure 9
Figure 9
Different microbial composition and development of biomarkers. (a) Linear discriminant analysis (LDA) effect size (LEfSe), with a LDA threshold value ≥ 4.0, was used to evaluate the interaction of particular microbiota taxa with H and L group. (b) Cladogram showed differently abundant taxa of the duodenal microbiota between H and L groups with the respective cladograms from phylum to species level abundance. Red denotes taxa abundant in H group, and green denotes taxa abundant in L group.
Figure 10
Figure 10
The genus-level microbiome Spearman’s correlation network. The red line denotes substantial positive relation (p < 0.05) whereas the blue line reflects notable negative relation (p < 0.05).
Figure 11
Figure 11
Functional prediction analysis. The relative abundance of Tax4Fun Functional taxa was analyzed among samples (intragroup) (a); and between H and L groups (b); (c) Tax4Fun function annotation clustering heat map. In the microbiota metabolism pathway, red denotes higher enrichment while blue denotes lower enrichment.

Similar articles

Cited by

References

    1. Hayes M. Food proteins and bioactive peptides: New and novel sources, characterisation strategies and applications. Foods. 2018;7:38. doi: 10.3390/foods7030038. - DOI - PMC - PubMed
    1. Mueller S., Kreuzer M., Siegrist M., Mannale K., Messikommer R.E., Gangnat I.D.M. Carcass and meat quality of dual-purpose chickens (Lohmann Dual, Belgian Malines, Schweizerhuhn) in comparison to broiler and layer chicken types. Poult. Sci. 2018;97:3325–3336. doi: 10.3382/ps/pey172. - DOI - PubMed
    1. Marchesi J.A.P., Ono R.K., Cantao M.E., Ibelli A.M.G., Peixoto J.O., Moreira G.C.M., Godoy T.F., Coutinho L.L., Munari D.P., Ledur M.C. Exploring the genetic architecture of feed efficiency traits in chickens. Sci. Rep. 2021;11:4622. doi: 10.1038/s41598-021-84125-9. - DOI - PMC - PubMed
    1. Qiaoxian Y., Hui C., Yingjue X., Chenxuan H., Jianzhong X., Rongyan Z., Lijun X., Han W., Ye C. Effect of housing system and age on products and bone properties of Taihang chickens. Poult. Sci. 2020;99:1341–1348. doi: 10.1016/j.psj.2019.10.052. - DOI - PMC - PubMed
    1. The NIH HMP Working Group. Peterson J., Garges S., Giovanni M., McInnes P., Wang L., Schloss J.A., Bonazzi V., McEwen J.E., Wetterstrand K.A., et al. The NIH Human Microbiome Project. Genome Res. 2009;19:2317–2323. - PMC - PubMed

LinkOut - more resources