. 2022 Aug 5;10(8):1574.
doi: 10.3390/microorganisms10081574.

Consortium of Indigenous Fecal Bacteria in the Treatment of Metabolic Syndrome

Affiliations

Consortium of Indigenous Fecal Bacteria in the Treatment of Metabolic Syndrome

Elena Ermolenko et al. Microorganisms. .

Abstract

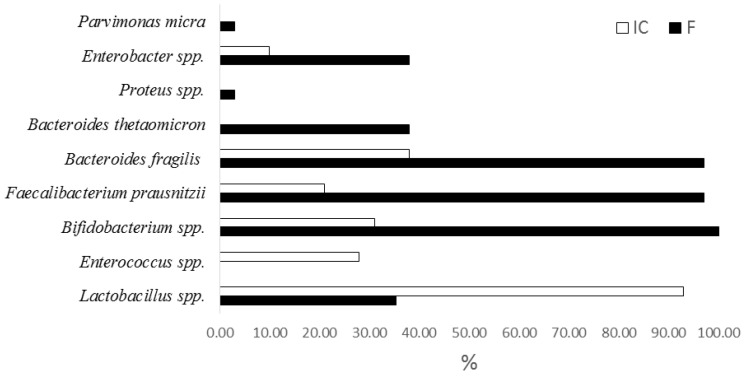
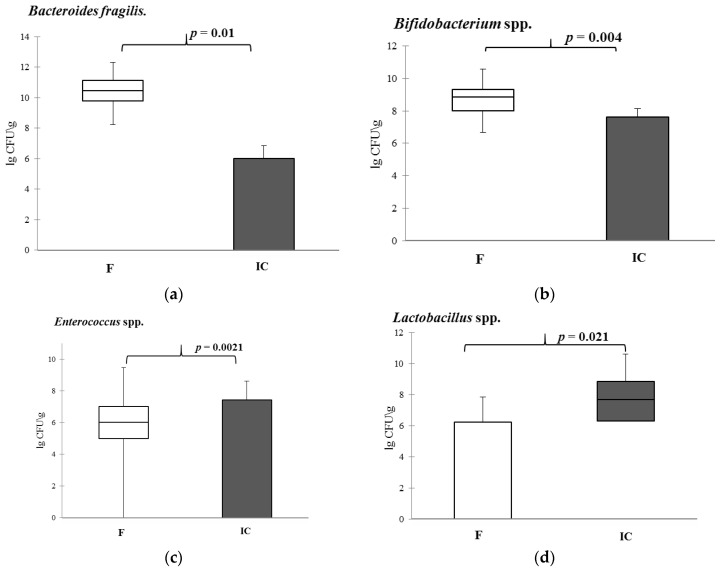
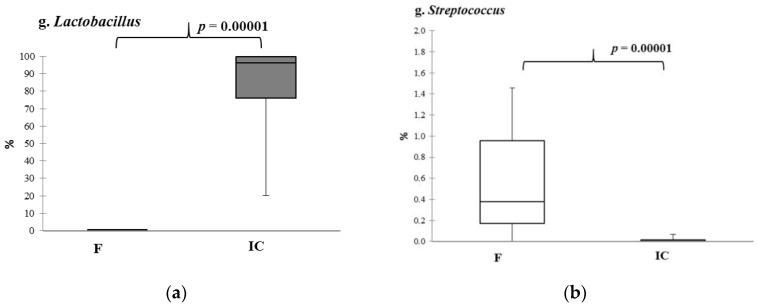
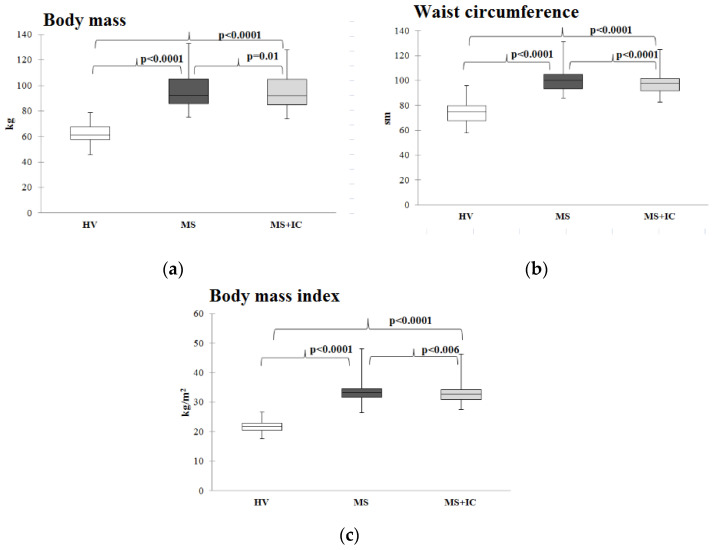
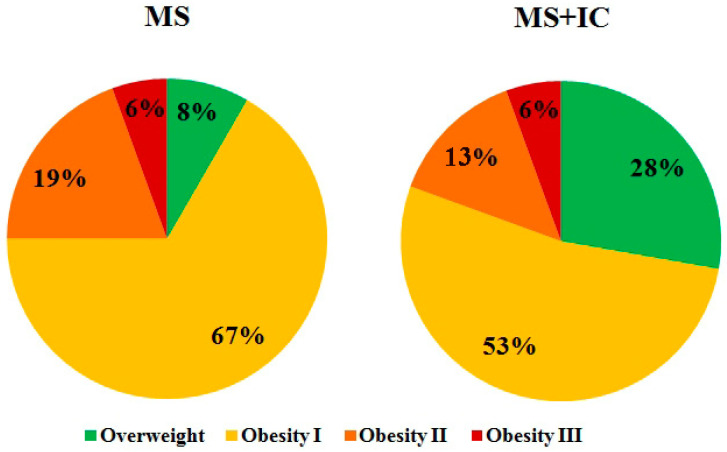
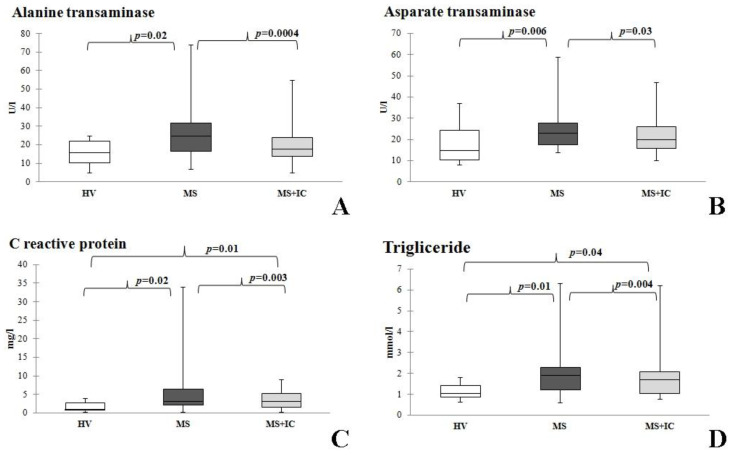
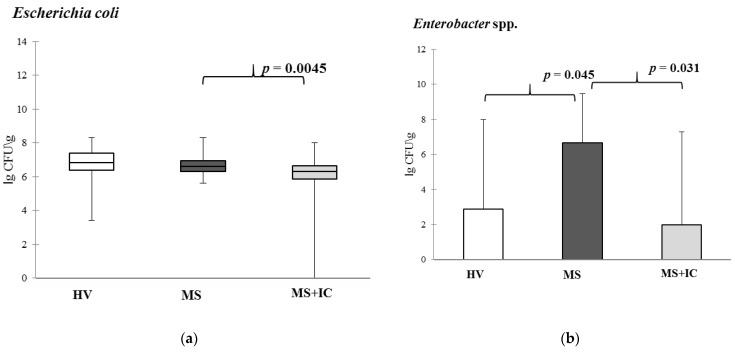
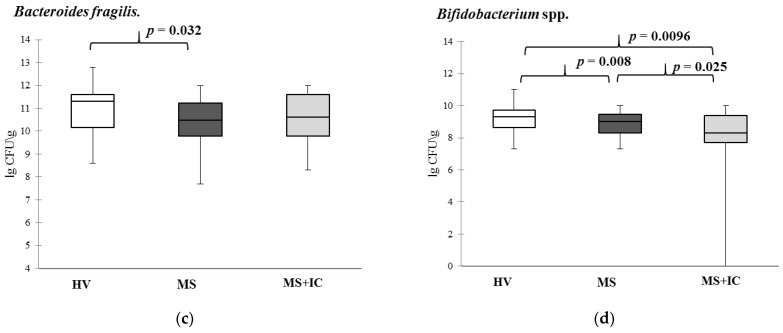
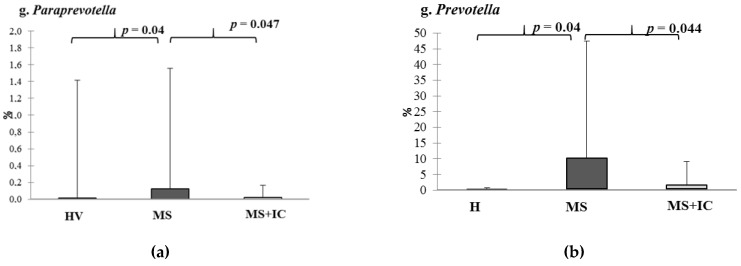
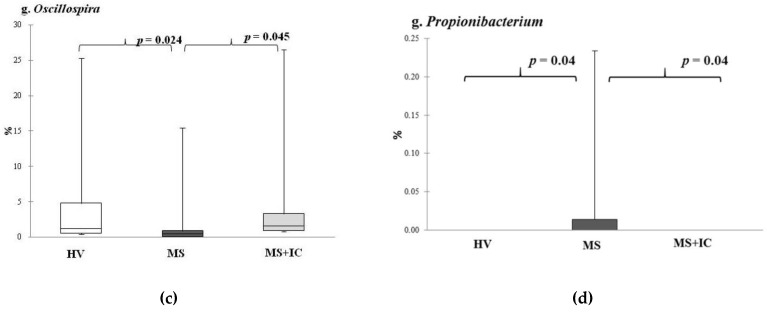
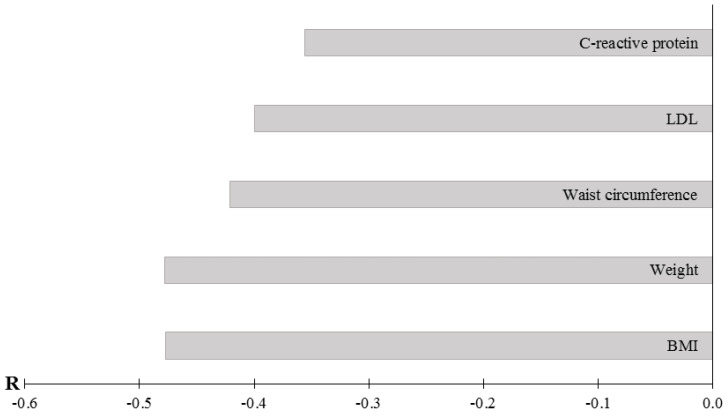
The features of gut microbiota in metabolic syndrome (MS) and ways to correct it using autoprobiotics, based on indigenous bacteria obtained from fecal samples of the host, remain unexplored. The aim of the study was to investigate the effectiveness of an indigenous consortium (IC) of fecal bacteria in treatment of patients with MS. The study was carried out on 36 patients with MS, manifested with abdominal obesity, eating disorders, dyslipidemia, and hypertension. The control group was formed by 20 healthy volunteers. Samples of IC and gut microbiota content were examined by qPCR and metagenome (16S rRNA) analysis before and after therapy. The decrease in anthropometric parameters of obesity, liver enzyme level correction, reduction in C reactive protein and triglyceride concentrations were revealed after IC usage. The decrease in genera Bifidobacterium, Enterobacter, Paraprevotella, and Prevotella, as well as an increase in Bacteroides fragilis and Oscillospira spp. populations were shown after consumption of IC. A negative correlation between the quantity of B. fragilis and the anthropometric parameters of obesity (r = -0.48) and C reactive protein level (r = -0.36) in serum was established. Thus, IC can be considered as a potential functional personified product for the therapy of MS.

Keywords: Bacteroides fragilis; Bifidobacterium spp.; Lactobacillus spp.; autoprobiotics; dyslipidemia; eating disorders; indigenous consortium; obesity.


Conflict of interest statement

The authors declare no conflict of interest.

Figures

Figure 1
Figure 1
Frequency of different taxa identification in the composition of fecal samples and the indigenous consortium by qPCR study. Notes: Lactobacillus spp. > 5 lg CFU/g; Enetrococcus > 5 lg CFU/g; F—fecal samples; IC—indigenous consortium. Only statistically reliable results are presented. p < 0.05 were determined by χ2 test with Yates correction.
Figure 2
Figure 2
Quantity content of Bifidobacterium (a), Bacteroides fragilis (b), Enterococcus (c) and Lactobacillus (d) genera in the fecal samples and indigenous consortiums. Notes: F—fecal samples; IC—indigenous consortium. Results are presented as median (25%; 75%).
Figure 3
Figure 3
The relative abundance of Lactobacillus spp. (a) and Streptococcus spp. (b) in the fecal samples and indigenous consortiums. Notes: F—fecal samples; IC—indigenous consortium. Results are presented as median (25%; 75%).
Figure 4
Figure 4
Body mass (a), waist circumference (b), and body mass index (c) of patients with MS before and after therapy. Notes: HV—healthy volunteers; MS—patients with metabolic syndrome; MS+IC—patients with metabolic syndrome after consumption of indigenous consortium. Results are presented as median (25%; 75%).
Figure 5
Figure 5
Distribution by severity of obesity before and after therapy. Notes: Classification of obesity by BMI: body weight deficit < 18.5 kg/m2; normal body weight 18.5–24.9 kg/m2; overweight 25–29.9 kg/m2; obesity of the 1st degree 30–34.9 kg/m2; obesity of the 2nd degree 35–39.9 kg/m2; obesity of the 3rd degree ≥ 40 kg/m2. MS—patients with metabolic syndrome; MS+IC—patients with metabolic syndrome after consumption of indigenous consortium.
Figure 6
Figure 6
Biochemical parameters of blood serum before and after therapy. Alanine transaminase (A), Aspaparate transaminase (B), Creactive protein (C) and Trigliceride (D). Notes: HV—healthy volunteers; MS—patients with metabolic syndrome; MS + IC—patients with metabolic syndrome after consumption of indigenous consortium. Results are presented as median (25%; 75%).
Figure 7
Figure 7
Microbiota content of patients with MS before and after IC by qPCR. Escherichia coli (a), Enterobacter spp. (b), Bacteroides fragilis (c) and Bifidobacterium spp. (d). Notes: HV—healthy volunteers; MS—patients with metabolic syndrome; MS+IC—patients with metabolic syndrome after consumption of indigenous consortium. Results are presented as median (25%; 75%).
Figure 7
Figure 7
Microbiota content of patients with MS before and after IC by qPCR. Escherichia coli (a), Enterobacter spp. (b), Bacteroides fragilis (c) and Bifidobacterium spp. (d). Notes: HV—healthy volunteers; MS—patients with metabolic syndrome; MS+IC—patients with metabolic syndrome after consumption of indigenous consortium. Results are presented as median (25%; 75%).
Figure 8
Figure 8
The relative abundance of microbiota content of patients with MS before and after IC by metagenome study (16S rRNA). Genera: Paraprevotella (a), Prevotella (b), Oscillospira (c) and Propionibacterium (d). Notes: HV—healthy volunteers; MS—patients with metabolic syndrome; MS + IC—patients with metabolic syndrome after consumption of indigenous consortium. Results are presented as median (25%; 75%).
Figure 8
Figure 8
The relative abundance of microbiota content of patients with MS before and after IC by metagenome study (16S rRNA). Genera: Paraprevotella (a), Prevotella (b), Oscillospira (c) and Propionibacterium (d). Notes: HV—healthy volunteers; MS—patients with metabolic syndrome; MS + IC—patients with metabolic syndrome after consumption of indigenous consortium. Results are presented as median (25%; 75%).
Figure 9
Figure 9
Correlation coefficients between Bacteroides fragilis content and anthropometric and biochemical parameters. Notes: total data for all patients, the results of the study are presented using p < 0.05. A search for correlations between the studied parameters was performed using Spearman’s test.

References

    1. Eckel R.H., Grundy S.M., Zimmet P.Z. The metabolic syndrome. Lancet. 2005;365:1415–1428. doi: 10.1016/S0140-6736(05)66378-7. - DOI - PubMed
    1. Laaksonen D.E., Niskanen L., Lakka H.M., Lakka T.A., Uusitupa M. Epidemiology and treatment of the metabolic syndrome. Ann. Med. 2004;36:332–346. doi: 10.1080/07853890410031849. - DOI - PubMed
    1. Kurmangulov A.A., Dorodneva E.F., Isakova D.N. Functional activity of intestinal microbiota with metabolic syndrome. Obes. Metab. 2016;13:16–19. doi: 10.14341/omet2016116-19. - DOI
    1. Buttó L., Haller D. Dysbiosis in intestinal inflammation: Cause or consequence. Int. J. Med. Microbiol. 2016;306:302–309. doi: 10.1016/j.ijmm.2016.02.010. - DOI - PubMed
    1. Wang P.X., Deng X.R., Zhang C.H., Yuan H.J. Gut microbiota and metabolic syndrome. Chin. Med. J. 2020;133:808–816. doi: 10.1097/CM9.0000000000000696. - DOI - PMC - PubMed