

Enhancing Mixing Performance in a Rotating Disk Mixing Chamber: A Quantitative Investigation of the Effect of Euler and Coriolis Forces
- PMID: 36014138
- PMCID: PMC9416410
- DOI: 10.3390/mi13081218
Enhancing Mixing Performance in a Rotating Disk Mixing Chamber: A Quantitative Investigation of the Effect of Euler and Coriolis Forces
Abstract
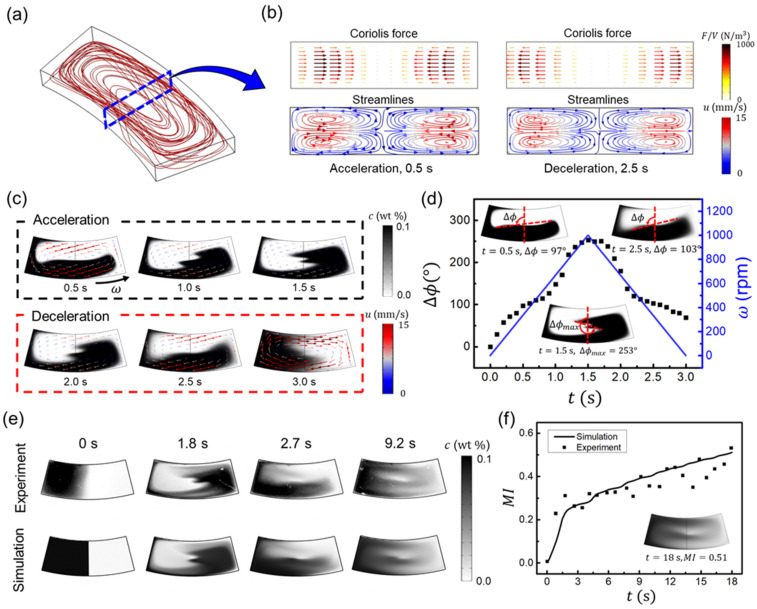
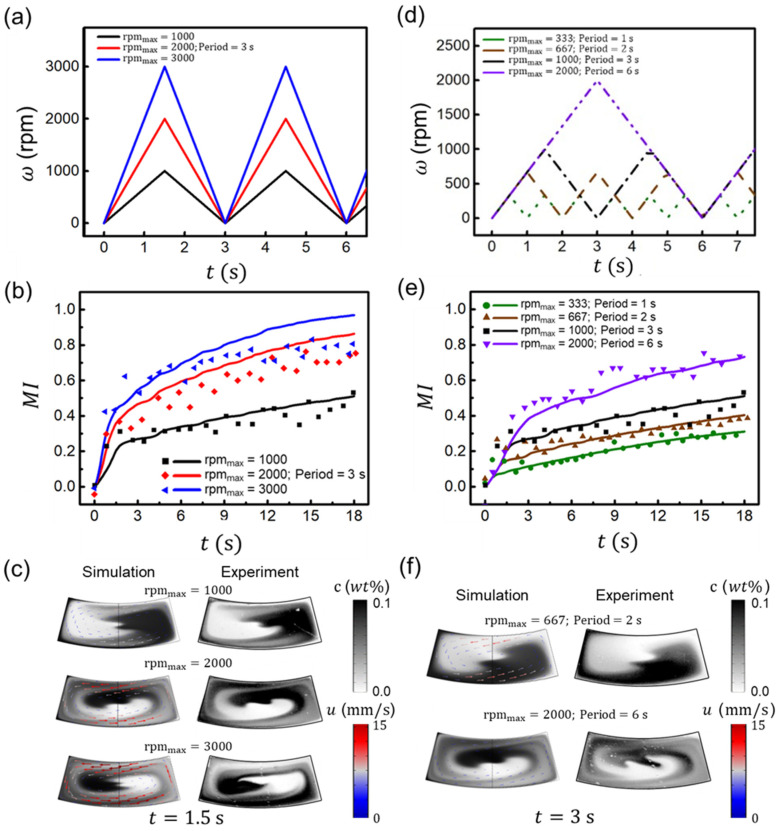
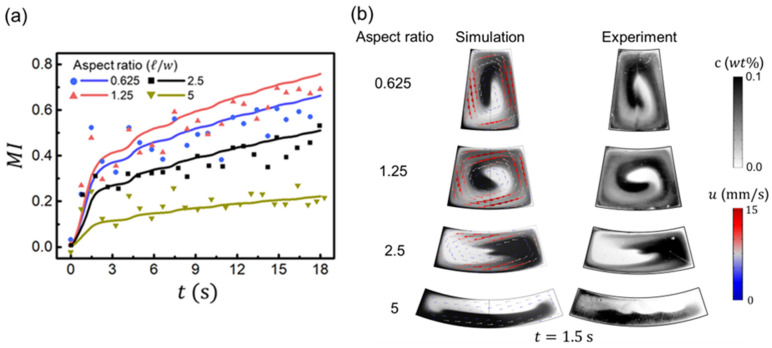
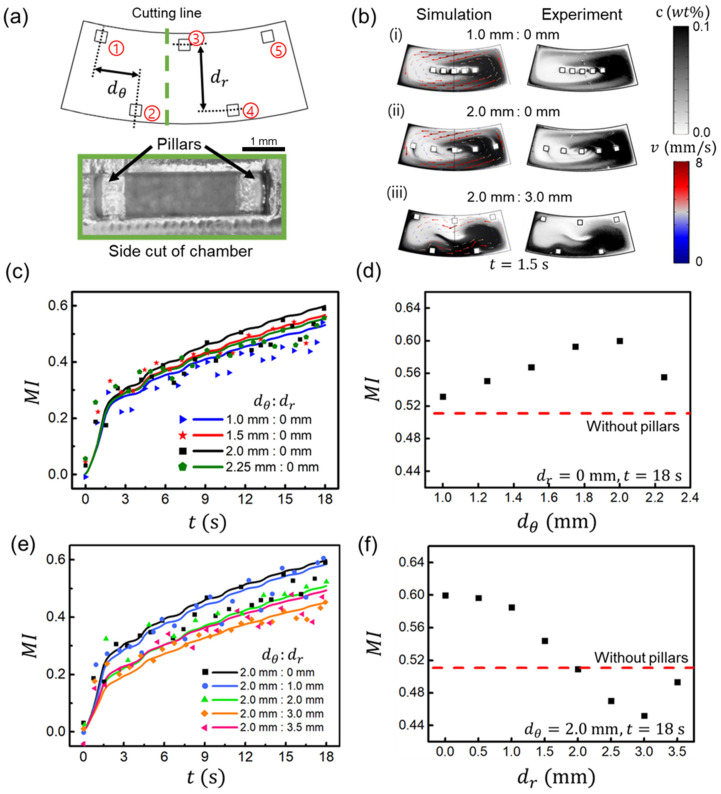
Lab-on-a-CD (LOCD) is gaining importance as a diagnostic platform due to being low-cost, easy-to-use, and portable. During LOCD usage, mixing and reaction are two processes that play an essential role in biochemical applications such as point-of-care diagnosis. In this paper, we numerically and experimentally investigate the effects of the Coriolis and Euler forces in the mixing chamber during the acceleration and deceleration of a rotating disk. The mixing performance is investigated under various conditions that have not been reported, such as rotational condition, chamber aspect ratio at a constant volume, and obstacle arrangement in the chamber. During disk acceleration and deceleration, the Euler force difference in the radial direction causes rotating flows, while the Coriolis force induces perpendicular vortices. Increasing the maximum rotational velocity improves the maximum rotational displacement, resulting in better mixing performance. A longer rotational period increases the interfacial area between solutions and enhances mixing. Mixing performance also improves when there is a substantial difference between Euler forces at the inner and outer radii. Furthermore, adding obstacles in the angular direction also passively promotes or inhibits mixing by configuration. This quantitative investigation provides valuable information for designing and developing high throughput and multiplexed point-of-care LOCDs.
Keywords: Coriolis force; Euler force; microfluidics; mixing; rotating disk.
Conflict of interest statement
The authors declare no conflict of interest.
Figures
Similar articles
-
Lab on a bead with oscillatory centrifugal microfluidics for fast and complete mixing enables fast and accurate biomedical assays.Sci Rep. 2024 Apr 15;14(1):8637. doi: 10.1038/s41598-024-58720-5. Sci Rep. 2024. PMID: 38622241 Free PMC article.
-
Enhancement of Fluid Mixing with U-Shaped Channels on a Rotating Disc.Micromachines (Basel). 2020 Dec 15;11(12):1110. doi: 10.3390/mi11121110. Micromachines (Basel). 2020. PMID: 33334076 Free PMC article.
-
The Effect of Moment of Inertia on the Liquids in Centrifugal Microfluidics.Micromachines (Basel). 2016 Dec 2;7(12):215. doi: 10.3390/mi7120215. Micromachines (Basel). 2016. PMID: 30404391 Free PMC article.
-
Adaptation to rotating artificial gravity environments.J Vestib Res. 2003;13(4-6):321-30. J Vestib Res. 2003. PMID: 15096675 Review.
-
The possible role of Coriolis forces in structuring large-scale sinuous patterns of submarine channel-levee systems.Philos Trans A Math Phys Eng Sci. 2013 Nov 4;371(2004):20120366. doi: 10.1098/rsta.2012.0366. Print 2013. Philos Trans A Math Phys Eng Sci. 2013. PMID: 24191118 Review.
Cited by
-
Analysis of Von Kármán Swirling Flows Due to a Porous Rotating Disk Electrode.Micromachines (Basel). 2023 Feb 28;14(3):582. doi: 10.3390/mi14030582. Micromachines (Basel). 2023. PMID: 36984988 Free PMC article.
-
Room temperature roll-to-roll additive manufacturing of polydimethylsiloxane-based centrifugal microfluidic device for on-site isolation of ribonucleic acid from whole blood.Mater Today Bio. 2023 Nov 3;23:100838. doi: 10.1016/j.mtbio.2023.100838. eCollection 2023 Dec. Mater Today Bio. 2023. PMID: 38033369 Free PMC article.
References
Grants and funding
- HI20C0629/Korea Health Industry Development Institute/Republic of Korea
- 2019002790003/Korea Environmental Industry and Technology Institute
- NRF2020R1A2C3010568/National Research Foundation of Korea
- 2020R1A5A1019649/National Research Foundation of Korea
- 2021M3A9I4021220/National Research Foundation of Korea
LinkOut - more resources
Full Text Sources
Miscellaneous
