. 2022 Aug 8;13(8):1280.
doi: 10.3390/mi13081280.

Comparing the Replication Fidelity of Solid Microneedles Using Injection Compression Moulding and Conventional Injection Moulding

Affiliations

Comparing the Replication Fidelity of Solid Microneedles Using Injection Compression Moulding and Conventional Injection Moulding

Tim Evens et al. Micromachines (Basel). .

Abstract

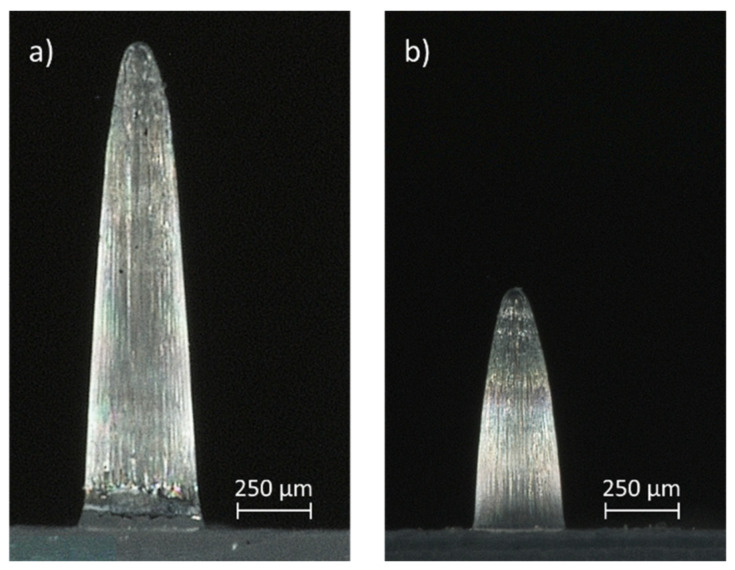
Polymer surfaces are increasingly being functionalized with micro- and nano- surface features using mass replication methods such as injection moulding. An example of these are microneedle arrays, which contain needle-like microscopic structures, which facilitate drug or vaccine delivery in a minimally invasive way. In this study, the replication fidelity of two types of solid polycarbonate microneedles was investigated using injection compression moulding and conventional injection moulding. Using a full factorial design of experiments for the injection moulding process, it was found that the volumetric injection rate had the largest positive effect on the replication fidelity. The mould temperature and holding pressure were also found to have a positive effect, while the effect of the melt temperature was found to be insignificant for the considered temperature range. For the injection compression moulding process, it was found that a larger compression stroke resulted in a better replication fidelity. A comparison between the replication fidelity for the injection moulding and injection compression moulding indicated that the injection compression moulding process resulted in a higher and more uniform replication fidelity. Using finite element flow simulations, a higher and more evenly distributed cavity pressure was observed compared to the conventional injection moulding process.

Keywords: injection compression moulding; injection moulding; laser machining; micro manufacturing; microneedles.


Conflict of interest statement

The authors declare no conflict of interest.

Figures

Figure 1
Figure 1
Illustration of the flat plate mould product cavity, including the two different arrays of microneedle cavities located on 15 locations. The polymer is injected through a hot runner, located in the centre of the mould product cavity.
Figure 2
Figure 2
Representation of the XY datasets of the reconstructed µCT analysis for 3 large and 3 small microneedle cavities. The average cavity depth and cavity base diameter, along with the standard deviation for the complete array of 9 microneedles is also displayed for both types of microneedles.
Figure 3
Figure 3
Illustration of a cross section of a microneedle cavity for (a) an empty large microneedle cavity, and (b) a large microneedle cavity from array 8 with an entrapped broken microneedle.
Figure 4
Figure 4
Average replication in height plotted against the 16 DoE runs with a repetition of 3 for (a) the large microneedle arrays and (b) the small microneedle arrays. The error bars represent the 95% confidence interval.
Figure 5
Figure 5
Illustration of one replicated large and small microneedle from array number 2 for (a) DoE run 13 (b) DoE run 11, (c) DoE run 3 and (d) DoE run 12. The average length of the needles is reported together with the standard deviation (n = 9).
Figure 6
Figure 6
Illustration of the DoE results, with the barrel temperature (Tbarrel), volumetric injection rate (vinj), holding pressure (Phold) and mould coolant temperature (Tmould) as the varied parameters. (a,b) show the Pareto charts for the large and small microneedles, respectively. The red dashed lines represent the significance limit at a confidence level of at 95%. (c,d) show the main effect plot for the replication in height for the large and small microneedles. (e,f) show the two-factor interactions for the replication in height for the large and small microneedles, respectively.
Figure 7
Figure 7
Illustration of the Cross–WLF model viscosity and online apparent viscosity for PC, measured at an injection rate of 50 cm3/s and 150 cm3/s in combination with a barrel temperature of 315 °C.
Figure 8
Figure 8
Illustration of a small microneedle which is (a) undeformed during the demoulding process, (b) deformed during the demoulding process.
Figure 9
Figure 9
The experimental and simulated replication in height in function of the microneedle arrays, created with the optimal IM parameters for (a) the large microneedle arrays and (b) the small microneedle arrays. The error bars represent the 95% confidence interval.
Figure 10
Figure 10
The average replication in height of the microneedle arrays as a function of the distance between the corresponding array and the gate location for (a) the large and small microneedle arrays together with a trendline and the linear correlation coefficient (R); (b) the experimental and simulated replication in height in function of the distance from the gate. The error bars represent the 95% confidence interval.
Figure 11
Figure 11
Illustration of the replication in height in function of the compression stroke obtained through ICM, for the large and small microneedles. The error bars represent the 95% confidence interval.
Figure 12
Figure 12
Illustration of the injected melt volume inside the mould cavity, before the mould compression phase, for the different compression strokes. The pink volume represents the compression gap. A compression stroke of 0 mm corresponds to conventional injection moulding.
Figure 13
Figure 13
The average replication in height of the microneedle arrays as a function of the distance between the corresponding array and the gate location for injection moulding and injection compression moulding using the process parameters for an optimal replication fidelity.
Figure 14
Figure 14
Illustration of a single (a) large and (b) small microneedle from array 1, created with ICM having a mould stroke of 4 mm.
Figure 15
Figure 15
Illustration of the simulated melt front time, temperature and pressure of the macroscopic part and a small microneedle from array 1 for injection moulding (IM) and injection compression moulding (ICM) with a stroke of 4 mm, at (a) a filling time of 0.1 s and (b) a filling time of 0.2 s.

References

    1. Maghsoudi K., Jafari R., Momen G., Farzaneh M. Micro-Nanostructured Polymer Surfaces Using Injection Molding: A Review. Mater. Today Commun. 2017;13:126–143. doi: 10.1016/j.mtcomm.2017.09.013. - DOI
    1. Nagarkar R., Singh M., Nguyen H.X., Jonnalagadda S. A Review of Recent Advances in Microneedle Technology for Transdermal Drug Delivery. J. Drug Deliv. Sci. Technol. 2020;59:101923. doi: 10.1016/j.jddst.2020.101923. - DOI
    1. Evens T., Malek O., Castagne S., Seveno D., Van Bael A. A Novel Method for Producing Solid Polymer Microneedles Using Laser Ablated Moulds in an Injection Moulding Process. Manuf. Lett. 2020;24:29–32. doi: 10.1016/j.mfglet.2020.03.009. - DOI
    1. Evens T., Van Hileghem L., Dal Dosso F., Lammertyn J., Malek O., Castagne S., Seveno D., Van Bael A. Producing Hollow Polymer Microneedles Using Laser Ablated Molds in an Injection Molding Process. J. Micro Nano-Manuf. 2021;9:030902. doi: 10.1115/1.4051456. - DOI
    1. Evens T., Malek O., Castagne S., Seveno D., Van Bael A. Controlling the Geometry of Laser Ablated Microneedle Cavities in Different Mould Materials and Assessing the Replication Fidelity within Polymer Injection Moulding. J. Manuf. Process. 2021;62:535–545. doi: 10.1016/j.jmapro.2020.12.035. - DOI

LinkOut - more resources