. 2022 Jul 30;14(8):1595.
doi: 10.3390/pharmaceutics14081595.

Methylphenidate Analogues as a New Class of Potential Disease-Modifying Agents for Parkinson's Disease: Evidence from Cell Models and Alpha-Synuclein Transgenic Mice

Affiliations

Methylphenidate Analogues as a New Class of Potential Disease-Modifying Agents for Parkinson's Disease: Evidence from Cell Models and Alpha-Synuclein Transgenic Mice

Andrea Casiraghi et al. Pharmaceutics. .

Abstract

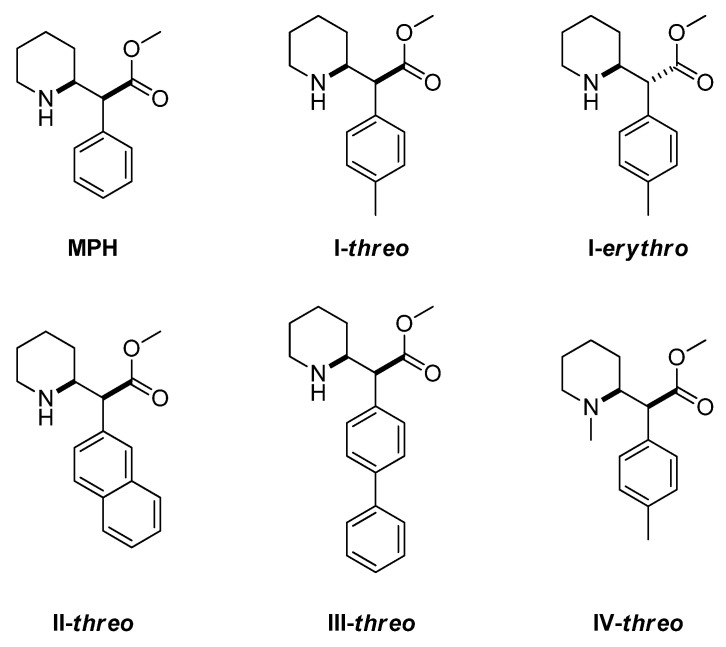
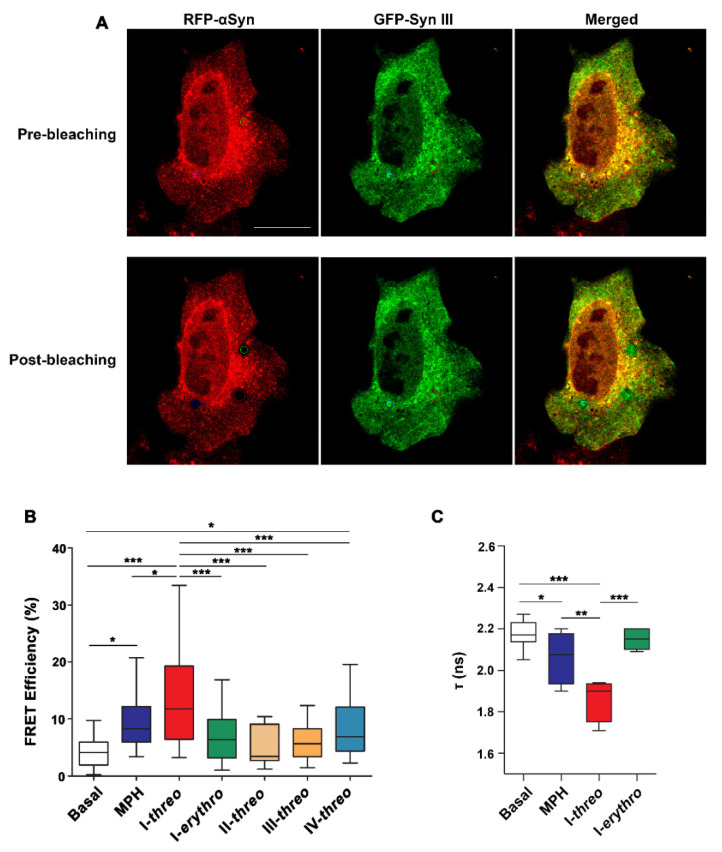
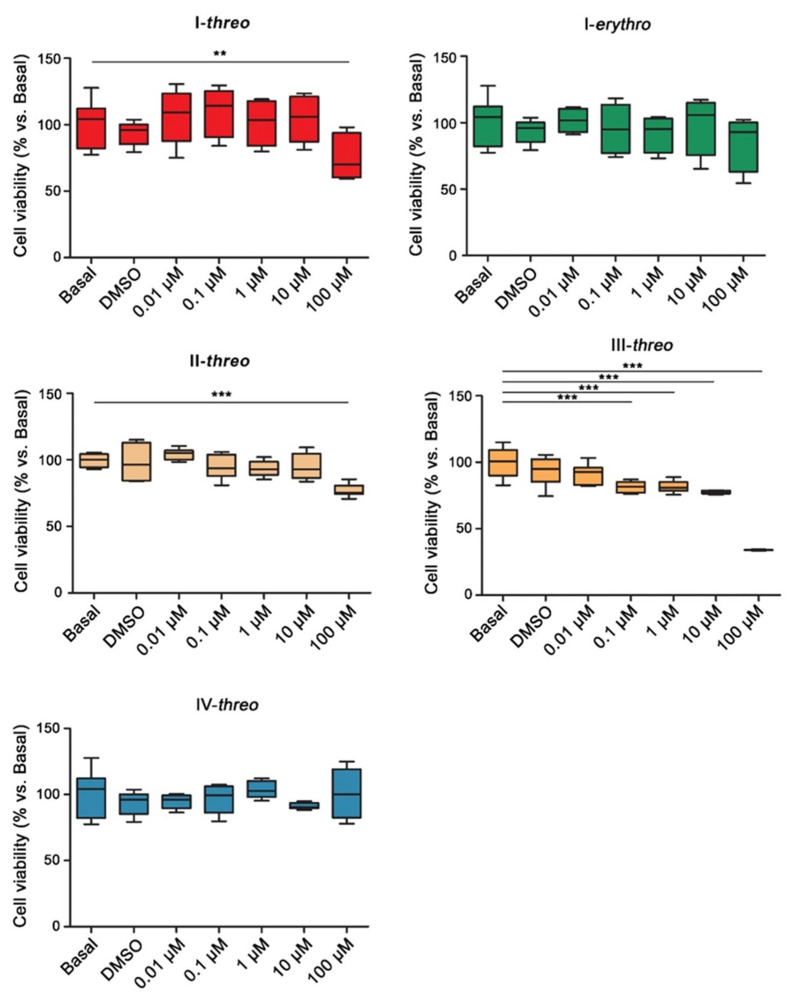
Parkinson's disease (PD) is characterized by dopaminergic nigrostriatal neurons degeneration and Lewy body pathology, mainly composed of α-synuclein (αSyn) fibrillary aggregates. We recently described that the neuronal phosphoprotein Synapsin III (Syn III) participates in αSyn pathology in PD brains and is a permissive factor for αSyn aggregation. Moreover, we reported that the gene silencing of Syn III in a human αSyn transgenic (tg) mouse model of PD at a pathological stage, manifesting marked insoluble αSyn deposits and dopaminergic striatal synaptic dysfunction, could reduce αSyn aggregates, restore synaptic functions and motor activities and exert neuroprotective effects. Interestingly, we also described that the monoamine reuptake inhibitor methylphenidate (MPH) can recover the motor activity of human αSyn tg mice through a dopamine (DA) transporter-independent mechanism, which relies on the re-establishment of the functional interaction between Syn III and α-helical αSyn. These findings support that the pathological αSyn/Syn III interaction may constitute a therapeutic target for PD. Here, we studied MPH and some of its analogues as modulators of the pathological αSyn/Syn III interaction. We identified 4-methyl derivative I-threo as a lead candidate modulating αSyn/Syn III interaction and having the ability to reduce αSyn aggregation in vitro and to restore the motility of αSyn tg mice in vivo more efficiently than MPH. Our results support that MPH derivatives may represent a novel class of αSyn clearing agents for PD therapy.

Keywords: Parkinson’s disease; methylphenidate analogues; motor recovery effect; threo methyl 2-(piperidin-2-yl)-2-(p-tolyl)acetate hydrochloride; α-synuclein/synapsin III complex.


Conflict of interest statement

The authors declare no conflict of interest.

Figures

Figure 1
Figure 1
Structures of methylphenidate (MPH) and MPH analogues I-IV object of the present manuscript.
Scheme 1
Scheme 1
Reagents and conditions: (a) Boc2 O, TEA, MeOH, 50 °C/RT; (b) TBTU, TEA (Triethylamine), morpholine, RT; (c) ArBr, n-BuLi, THF, −78 °C; (d) PPh3 CH3 Br, t-BuOK, THF, RT; (e) BH3·THF, H20, NaOH, H2 O2, THF, RT; (f) PDC, DMF, RT; (g) TMSCHN2, toluene, MeOH; (h) HCl/MeOH, RT to 60 °C; (i) HCOOH, formaldehyde, Pd/C, 18 h, 50 °C.
Figure 2
Figure 2
Acceptor photobleaching FRET and FLIM analysis in GFP-Syn III/RFP-α-Syn-overexpressing neuroblastoma cells: (A) Representative images showing control SK-N-SH cell overexpressing RFP-αSyn and GFP-Syn III pre and post bleaching. Please note the RFP bleached areas in the second row (Scale bar = 20 μm). (B) The graph shows the FRET efficiency between the GFP/RFP fluorophore couple, and thus the interaction between αSyn and Syn III, measured in SK-N-SH cells treated with 10 μM MPH or MPH analogs for 15 min. Boxplots represent the distribution of the 75%, 50%, and 25% of the values. MPH (*** p < 0.001 vs. Basal), compound I-threo (*** p < 0.001) and IV-threo (** p < 0.01) induced a significant increase in FRET efficiency, while compound I-erythro, II-threo and III-threo did not significantly affect FRET efficiency when compared to Basal condition (one-way ANOVA with Dunnett’s Multiple Comparison Test). Compound I-threo FRET efficiency was significantly higher than that of MPH (* p < 0.05, ** p < 0.01; *** p < 0.001, one-way ANOVA with Dunnett’s Multiple Comparison Test). (C) The graph shows the analysis of FLIM-FRET of the donor GFP exerted on SK-N-SH cells expressing GFP-Syn III and RFP-αSyn, expressed as τ amplitude in ns. Boxplots represent the distribution of the 75%, 50%, and 25% of the values. MPH and I-threo induced a significant decrease in the GFP-Syn III lifetime vs. Basal (* p < 0.05; *** p < 0.001, one-way ANOVA with Newman–Keuls Multiple Comparison Test). The effect of compound I-threo also significantly differed from that of its stereoisomer I-erythro (*** p < 0.001, one-way ANOVA with Newman–Keuls Multiple Comparison Test) that exhibited a tau amplitude compared to basal samples. The FLIM analysis also confirmed that I-threo was more effective than MPH in improving αSyn/Syn III interaction, as supported by the significant decrease in tau amplitude observed in the I-threo-treated cells when compared to the MPH-treated cells (** p< 0.05, one-way ANOVA with Newman–Keuls Multiple Comparison Test).
Figure 3
Figure 3
Cell viability of primary mesencephalic neurons treated with MPH-derived compounds. Graphs are showing the percentage changes in cell viability in primary mesencephalic neurons treated with increasing concentrations of compound I-threo, I-erythro, II-threo, III-threo, IV-erythro assayed by the MTT method. Boxplots represent the distribution of the 75%, 50%, and 25% of the values. Compound I-threo and II-threo showed toxic effects at 100 μM concentration. Compound III-threo exhibited strong toxic effects still at 0.1 μM. This effect was significantly worsened at 100 μM concentration (**, p < 0.01, *** p < 0.001 one-way ANOVA with Dunnett’s Multiple Comparison Test). Compound I-erythro and IV-threo did not affect cell viability.
Figure 4
Figure 4
Effect of compounds I-threo and IV-threo on αSyn aggregation in SK-N-SH cells overexpressing human wild-type (wt) αSyn and exhibiting the formation of αSyn intracellular inclusions. (A) Representative photomicrographs showing αSyn immunolabeling in SK-N-SH cells overexpressing human wt αSyn in basal condition or after the treatment with 10 μM of compound I-threo and IV-threo. Cell nuclei were labelled with To-ProTM-3. The control cells exhibited accumulation of αSyn-positive staining and areas where several αSyn-positive inclusions were visible (white arrowheads) whereas the cells treated with I-threo or IV-threo showed a sparse signal, characterized by immunopositive small dots (Scale bar = 10 μm). (B) The graph is showing the quantification of the particle average size. Boxplots represent the distribution of the 75%, 50%, and 25% of the values. Statistical analysis confirmed a significant decrease in immunopositive dots dimension in the cells treated with I-threo (*** p < 0.001 vs. Untreated) and IV-threo (*** p < 0.001 vs. Untreated; one-way ANOVA with Newman–Keuls Multiple Comparison Test).
Figure 5
Figure 5
Effect of the treatment with compounds I-threo and IV-threo on αSyn aggregates formation in primary mesencephalic neurons. (A) Representative photomicrographs are showing αSyn and Syn III double labeling on primary mesencephalic neurons exposed to GD and treated with either 0.05 μM or 0.1 μM concentrations of compound I-threo and IV-threo. Cells exposed to GD exhibited the presence of αSyn/Syn III double-positive clumps (white arrowheads, magnifications), while the neurons exposed to GD and treated with 0.1 μM I-threo showed a more diffuse signal for αSyn and Syn III (Scale bars = 20 μm, 5 μm). (B) The graph shows the size of the αSyn-immunopositive particles measured as an index of the formation of αSyn aggregates. Please note that boxplots represent the distribution of the 75%, 50%, and 25% of the values. The significant increase in the size of αSyn-positive particles upon GD exposure was hampered by treatment with compound I-threo at 0.1 μM concentration. Conversely the treatment with 0.1 μM or 0.05 μM concentrations of compound IV-threo did not affect the αSyn-positive particle size after GD (** p < 0.01 and *** p < 0.001, one-way ANOVA with Newman–Keuls Multiple Comparison Test).
Figure 6
Figure 6
Effect of the acute i.p. administration of 10 mg/kg of compound I-threo, MPH or vehicle on the locomotor activity of SYN120 tg mice. (A) The graph shows the total distance travelled by the SYN120 tg mice in an open field arena upon vehicle, MPH and I-threo injection (arrow). Data are expressed as mean ± SEM. MPH acute administration induced a significant increase in the total distance travelled starting from 10 min after drug injection (20.0, 22.5, 25.0 min ** p < 0.01 vs. vehicle; 27.5, 30.0 min *** p < 0.001 vs. vehicle; 32.5 min ** p < 0.01 vs. vehicle; 35.0 min * p < 0.05 vs. vehicle; two-way ANOVA), as I-threo (20.0–35.0 min *** p < 0.001 vs. vehicle; two-way ANOVA). A significant increase in total distance travelled between by the mice subjected to I-threo, when compared to MPH acute treatment, since 12.5 min from drug administration was observed (22.5 min ° p < 0.05 vs. MPH; 25.0–32.5 min °° p < 0.01 vs. MPH; 35.0 min °°° p < 0.001 vs. MPH; two-way ANOVA). (B) The graph shows the time to traverse the beam registered from 10 min after the acute administration of vehicle, MPH or I-threo. Data are expressed as mean ± SEM. MPH and I-threo administration significantly reduced the time to transverse the beam when compared to vehicle-treated mice (*** p < 0.001, one-way ANOVA + Newman–Keuls Multiple comparison test). Compound I-threo reduced the time to transverse the beam more significantly that MPH (** p < 0.01, one-way ANOVA + Newman–Keuls Multiple comparison test).
Figure 7
Figure 7
Model of the αSyn/Syn III complex generated by protein–protein docking. (A) Syn III is depicted in blue and αSyn is represented in grey; (B) Detailed view showing the interacting residues of the two proteins (<5 Å), highlighted and labelled in blue for Syn III and in black for αSyn.
Figure 8
Figure 8
Overview of the results of the docking study showing the interaction motif of the studied compounds with the protein assembly. (A) Syn III is depicted in blue, and αSyn is represented in grey. MPH, I-threo, I-erythro, II-threo, III-threo and IV-threo are shown in grey, green, red, cyan, orange, purple, respectively; (B) Detailed view showing the interacting residues: MPH is depicted in grey and I-threo in red.

References

    1. Kile B.M., Guillot T.S., Venton B.J., Wetsel W.C., Augustine G.J., Wightman R.M. Synapsins differentially control dopamine and serotonin release. J. Neurosci. 2010;30:9762–9770. doi: 10.1523/JNEUROSCI.2071-09.2010. - DOI - PMC - PubMed
    1. Longhena F., Faustini G., Spillantini M.G., Bellucci A. Living in Promiscuity: The Multiple Partners of Alpha-Synuclein at the Synapse in Physiology and Pathology. Int. J. Mol. Sci. 2019;20:141. doi: 10.3390/ijms20010141. - DOI - PMC - PubMed
    1. Zaltieri M., Grigoletto J., Longhena F., Navarria L., Favero G., Castrezzati S., Colivicchi M.A., Della Corte L., Rezzani R., Pizzi M., et al. α-synuclein and synapsin III cooperatively regulate synaptic function in dopamine neurons. J. Cell Sci. 2015;128:2231–2243. doi: 10.1242/jcs.157867. - DOI - PubMed
    1. Bellucci A., Mercuri N.B., Venneri A., Faustini G., Longhena F., Pizzi M., Missale C., Spano P. Review: Parkinson’s disease: From synaptic loss to connectome dysfunction. Neuropathol. Appl. Neurobiol. 2016;42:77–94. doi: 10.1111/nan.12297. - DOI - PubMed
    1. Spillantini M.G., Goedert M. Neurodegeneration and the ordered assembly of α-synuclein. Cell Tissue Res. 2018;373:137–148. doi: 10.1007/s00441-017-2706-9. - DOI - PMC - PubMed