

Investigating Wrist-Based Acceleration Summary Measures across Different Sample Rates towards 24-Hour Physical Activity and Sleep Profile Assessment
- PMID: 36015910
- PMCID: PMC9413015
- DOI: 10.3390/s22166152
Investigating Wrist-Based Acceleration Summary Measures across Different Sample Rates towards 24-Hour Physical Activity and Sleep Profile Assessment
Abstract
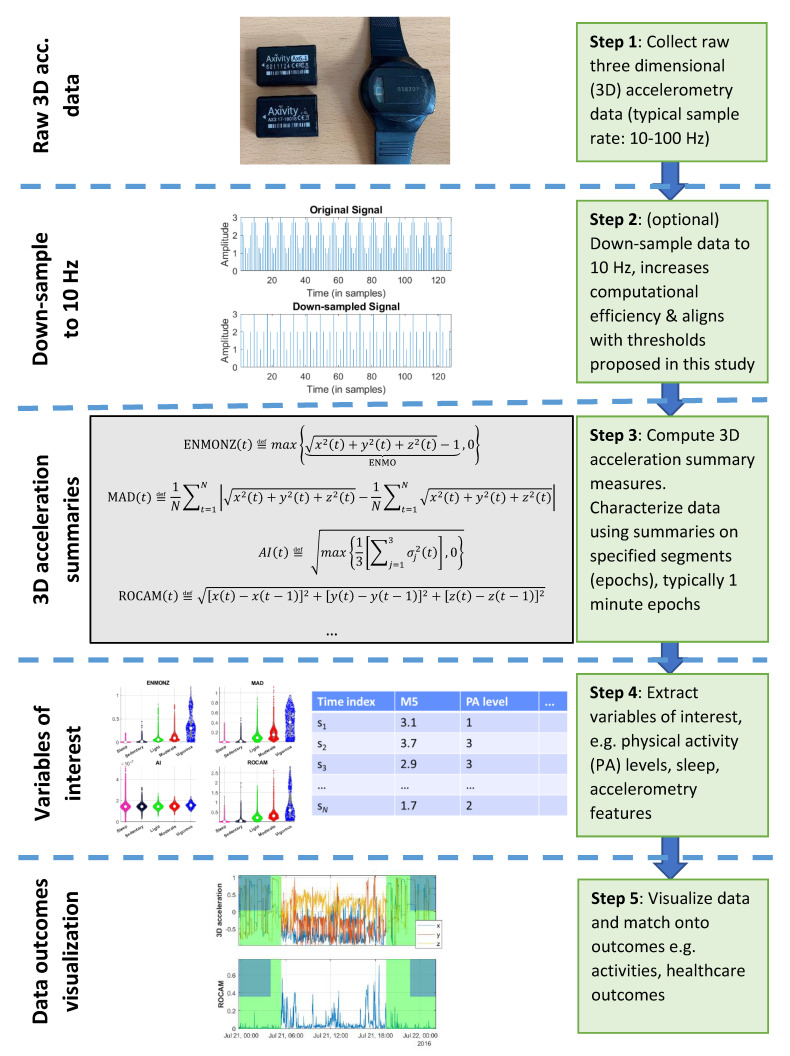
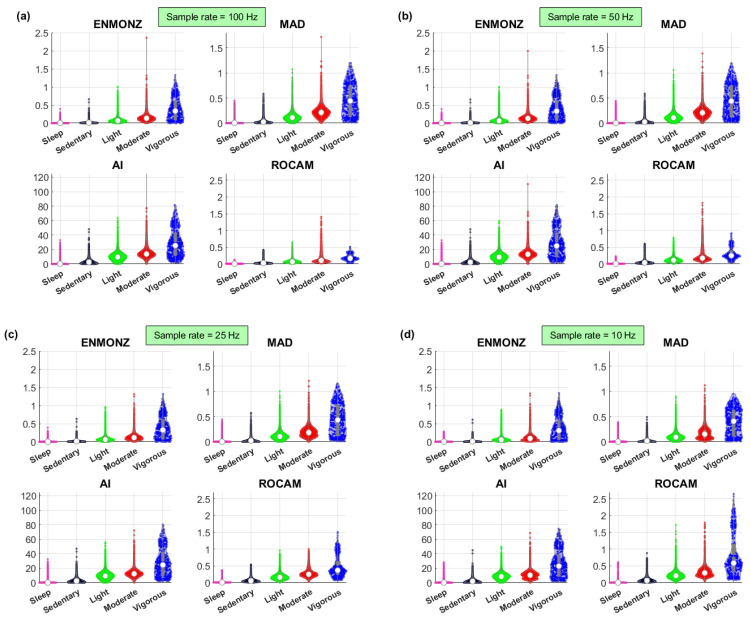
Wrist-worn wearable sensors have attracted considerable research interest because of their potential in providing continuous, longitudinal, non-invasive measurements, leading to insights into Physical Activity (PA), sleep, and circadian variability. Three key practical considerations for research-grade wearables are as follows: (a) choosing an appropriate sample rate, (b) summarizing raw three-dimensional accelerometry data for further processing (accelerometry summary measures), and (c) accurately estimating PA levels and sleep towards understanding participants' 24-hour profiles. We used the CAPTURE-24 dataset, where 148 participants concurrently wore a wrist-worn three-dimensional accelerometer and a wearable camera over approximately 24 h to obtain minute-by-minute labels: sleep; and sedentary light, moderate, and vigorous PA. We propose a new acceleration summary measure, the Rate of Change Acceleration Movement (ROCAM), and compare its performance against three established approaches summarizing three-dimensional acceleration data towards replicating the minute-by-minute labels. Moreover, we compare findings where the acceleration data was sampled at 10, 25, 50, and 100 Hz. We demonstrate the competitive advantage of ROCAM towards estimating the five labels (80.2% accuracy) and building 24-hour profiles where the sample rate of 10 Hz is fully sufficient. Collectively, these findings provide insights facilitating the deployment of large-scale longitudinal actigraphy data processing towards 24-hour PA and sleep-profile assessment.
Keywords: 24-hour activity profile; Axivity AX3; actigraphy; metabolic equivalents (METs); physical activity; smartwatch; wrist-worn wearable sensor.
Conflict of interest statement
The authors declare no conflict of interest.
Figures


Similar articles
-
Validation of a physical activity accelerometer device worn on the hip and wrist against polysomnography.Sleep Health. 2018 Apr;4(2):209-216. doi: 10.1016/j.sleh.2017.12.007. Epub 2018 Jan 17. Sleep Health. 2018. PMID: 29555136 Free PMC article.
-
AccNet24: A deep learning framework for classifying 24-hour activity behaviours from wrist-worn accelerometer data under free-living environments.Int J Med Inform. 2023 Apr;172:105004. doi: 10.1016/j.ijmedinf.2023.105004. Epub 2023 Jan 25. Int J Med Inform. 2023. PMID: 36724729
-
Wrist Accelerometry for Physical Activity Measurement in Individuals With Spinal Cord Injury-A Need for Individually Calibrated Cut-Points.Arch Phys Med Rehabil. 2018 Apr;99(4):684-689. doi: 10.1016/j.apmr.2017.10.024. Epub 2017 Dec 6. Arch Phys Med Rehabil. 2018. PMID: 29222006
-
The Role of Wearable Sensors to Monitor Physical Activity and Sleep Patterns in Older Adult Inpatients: A Structured Review.Sensors (Basel). 2023 May 18;23(10):4881. doi: 10.3390/s23104881. Sensors (Basel). 2023. PMID: 37430796 Free PMC article. Review.
-
Assessment of Physical Activity in Adults Using Wrist Accelerometers.Epidemiol Rev. 2022 Jan 14;43(1):65-93. doi: 10.1093/epirev/mxab004. Epidemiol Rev. 2022. PMID: 34215874 Free PMC article. Review.
Cited by
-
Behaviour-based movement cut-off points in 3-year old children comparing wrist- with hip-worn actigraphs MW8 and GT3X.PLoS One. 2025 Mar 26;20(3):e0316747. doi: 10.1371/journal.pone.0316747. eCollection 2025. PLoS One. 2025. PMID: 40138295 Free PMC article.
-
Quantifying Mild Cognitive Impairments in Older Adults Using Multi-modal Wearable Sensor Data in a Kitchen Environment.medRxiv [Preprint]. 2025 May 25:2025.05.24.25328107. doi: 10.1101/2025.05.24.25328107. medRxiv. 2025. PMID: 40661293 Free PMC article. Preprint.
-
Use of posterior probabilities from a long short-term memory network for characterizing dance behavior with multiple accelerometers.J Alzheimers Dis. 2025 Jun;105(4):1069-1084. doi: 10.1177/13872877251336482. Epub 2025 May 4. J Alzheimers Dis. 2025. PMID: 40320775 Free PMC article.
-
Quantifying Parkinson's disease severity using mobile wearable devices and machine learning: the ParkApp pilot study protocol.BMJ Open. 2023 Dec 28;13(12):e077766. doi: 10.1136/bmjopen-2023-077766. BMJ Open. 2023. PMID: 38154904 Free PMC article.
-
Insights into endometriosis symptom trajectories and assessment of surgical intervention outcomes using longitudinal actigraphy.NPJ Digit Med. 2025 May 2;8(1):236. doi: 10.1038/s41746-025-01629-8. NPJ Digit Med. 2025. PMID: 40316659 Free PMC article.
References
-
- Hall J.E., Hall M.E. Guyton and Hall Textbook of Medical Physiology. 14th ed. Elsevier; Philadelphia, PA, USA: 2021.
-
- Walmsley R., Chan S., Smith-Byrne K., Ramakrishnan R., Woodward M., Rahimi K., Dwyer T., Bennett D., Doherty A. Reallocation of Time between Device-Measured Movement Behaviours and Risk of Incident Cardiovascular Disease. Br. J. Sports Med. 2021:104050. doi: 10.1136/bjsports-2021-104050. - DOI - PMC - PubMed
-
- Kryger M.H., Roth T., Dement W.C. Principles and Practice of Sleep Medicine. 5th ed. Saunders; Philadelphia, PA, USA: 2011.
MeSH terms
LinkOut - more resources
Full Text Sources
