. 2022 Aug 19;22(16):6249.
doi: 10.3390/s22166249.

ResNet-AE for Radar Signal Anomaly Detection

Affiliations

ResNet-AE for Radar Signal Anomaly Detection

Donghang Cheng et al. Sensors (Basel). .

Abstract

Radar signal anomaly detection is an effective method to detect potential threat targets. Given the low Accuracy of the traditional AE model and the complex network of GAN, an anomaly detection method based on ResNet-AE is proposed. In this method, CNN is used to extract features and learn the potential distribution law of data. LSTM is used to discover the time dependence of data. ResNet is used to alleviate the problem of gradient loss and improve the efficiency of the deep network. Firstly, the signal subsequence is extracted according to the pulse's rising edge and falling edge. Then, the normal radar signal data are used for model training, and the mean square error distance is used to calculate the error between the reconstructed data and the original data. Finally, the adaptive threshold is used to determine the anomaly. Experimental results show that the recognition Accuracy of this method can reach more than 85%. Compared with AE, CNN-AE, LSTM-AE, LSTM-GAN, LSTM-based VAE-GAN, and other models, Accuracy is increased by more than 4%, and it is improved in Precision, Recall, F1-score, and AUC. Moreover, the model has a simple structure, strong stability, and certain universality. It has good performance under different SNRs.

Keywords: LSTM; anomaly detection; autoencoder; deep learning; residual networks.


Conflict of interest statement

The authors declare no conflict of interest.

Figures

Figure 1
Figure 1
Radar signal dataset.
Figure 2
Figure 2
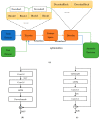
ResNet-AE network structure: (a) Overall structure; (b) Encoder residual structure; (c) Decoder residual structure.
Figure 3
Figure 3
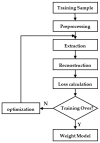
Model training algorithm flow.
Figure 4
Figure 4
Reconstructed signal during training.
Figure 5
Figure 5
Variation of training loss of several models.
Figure 6
Figure 6
Model testing algorithm flow.
Figure 7
Figure 7
Anomaly and reconstructed signal: (a) Original signal of an anomaly; (b) Reconstruction signal of anomaly.
Figure 8
Figure 8
Abnormal judgment.
Figure 9
Figure 9
Reconstruction signal of common anomaly detection models: (a) Abnormal detection results of AE; (b) Abnormal detection results of VAE; (c) Abnormal detection results of CNN-AE; (d) Abnormal detection results of LSTM-AE; (e) Abnormal detection results of ResNet-AE.
Figure 9
Figure 9
Reconstruction signal of common anomaly detection models: (a) Abnormal detection results of AE; (b) Abnormal detection results of VAE; (c) Abnormal detection results of CNN-AE; (d) Abnormal detection results of LSTM-AE; (e) Abnormal detection results of ResNet-AE.
Figure 10
Figure 10
Result evaluation of common anomaly detection models.
Figure 11
Figure 11
Complexity analysis of common anomaly detection models.
Figure 12
Figure 12
Reconstructed signals with different SNR: (a) Original signal and abnormal detection results; (b) Signal with SNR = 90 dB and its anomaly detection results; (c) Signal with SNR = 60 dB and its anomaly detection results; (d) Signal with SNR = 30 dB and its anomaly detection results.
Figure 12
Figure 12
Reconstructed signals with different SNR: (a) Original signal and abnormal detection results; (b) Signal with SNR = 90 dB and its anomaly detection results; (c) Signal with SNR = 60 dB and its anomaly detection results; (d) Signal with SNR = 30 dB and its anomaly detection results.
Figure 13
Figure 13
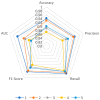
Evaluation of anomaly detection results under different signal-to-noise ratios.
Figure 14
Figure 14
Reconstructed signals of different radar: (a) Signal 1 and its abnormal detection results; (b) Signal 2 and its abnormal detection results; (c) Signal 3 and its abnormal detection results; (d) Signal 4 and its abnormal detection results; (e) Signal 5 and its abnormal detection results.
Figure 14
Figure 14
Reconstructed signals of different radar: (a) Signal 1 and its abnormal detection results; (b) Signal 2 and its abnormal detection results; (c) Signal 3 and its abnormal detection results; (d) Signal 4 and its abnormal detection results; (e) Signal 5 and its abnormal detection results.
Figure 15
Figure 15
Evaluation of abnormal detection results of different radar.

References

    1. Yang C.B. Research on Anomaly Detection Method of Electromagnetic Environment Based on Deep Learning. Harbin Engineering University; Harbin, China: 2020.
    1. Chandola V., Banerjee A., Kumar V. Anomaly Detection: A Survey. ACM Comput. Surv. 2009;41:1–58. doi: 10.1145/1541880.1541882. - DOI
    1. Hojjati H., Ho T., Armanfard N. Self-Supervised Anomaly Detection: A Survey and Outlook. arXiv. 20222205.05173 - PubMed
    1. Habeeb R.A.A., Nasaruddin F., Gani A., Hashem I.A.T., Ahmed E., Imran M. Real-time big data processing for anomaly detection: A Survey. Int. J. Inf. Manag. 2018;45:289–307. doi: 10.1016/j.ijinfomgt.2018.08.006. - DOI
    1. Ramaswamy S., Rastogi R., Shim K. Efficient Algorithms for Mining Outliers from Large Data Sets; Proceedings of the International Conference on Management of Data; Dallas, TX, USA. 15–18 May 2000; New York, NY, USA: ACM; 2000.

LinkOut - more resources