

Robust Phylodynamic Analysis of Genetic Sequencing Data from Structured Populations
- PMID: 36016270
- PMCID: PMC9413058
- DOI: 10.3390/v14081648
Robust Phylodynamic Analysis of Genetic Sequencing Data from Structured Populations
Abstract
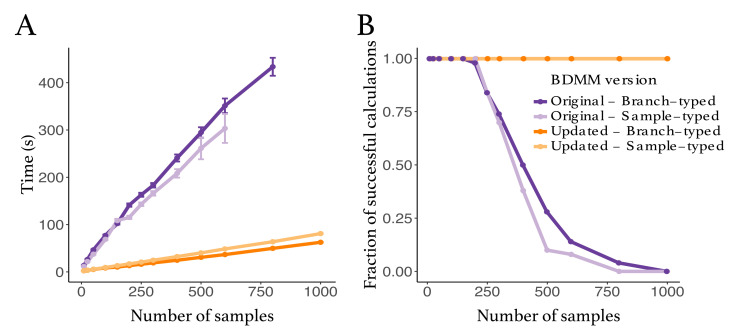
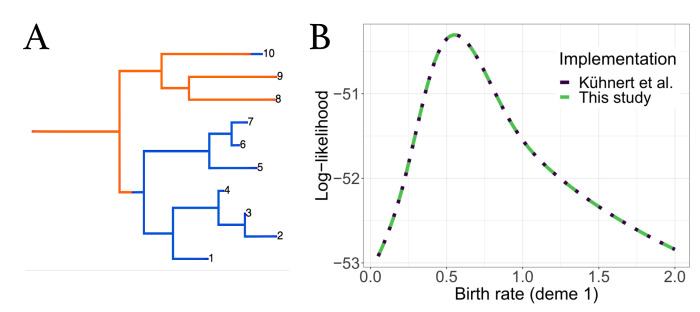
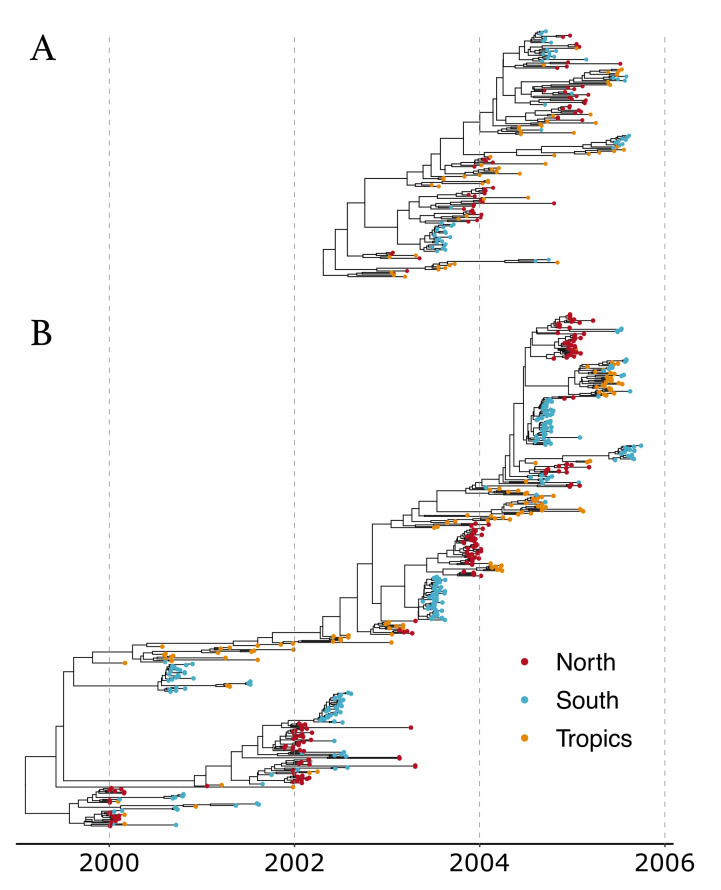
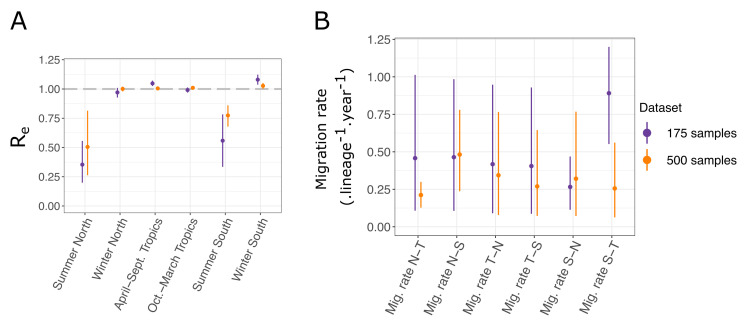
The multi-type birth-death model with sampling is a phylodynamic model which enables the quantification of past population dynamics in structured populations based on phylogenetic trees. The BEAST 2 package bdmm implements an algorithm for numerically computing the probability density of a phylogenetic tree given the population dynamic parameters under this model. In the initial release of bdmm, analyses were computationally limited to trees consisting of up to approximately 250 genetic samples. We implemented important algorithmic changes to bdmm which dramatically increased the number of genetic samples that could be analyzed and which improved the numerical robustness and efficiency of the calculations. Including more samples led to the improved precision of parameter estimates, particularly for structured models with a high number of inferred parameters. Furthermore, we report on several model extensions to bdmm, inspired by properties common to empirical datasets. We applied this improved algorithm to two partly overlapping datasets of the Influenza A virus HA sequences sampled around the world-one with 500 samples and the other with only 175-for comparison. We report and compare the global migration patterns and seasonal dynamics inferred from each dataset. In this way, we show the information that is gained by analyzing the bigger dataset, which became possible with the presented algorithmic changes to bdmm. In summary, bdmm allows for the robust, faster, and more general phylodynamic inference of larger datasets.
Keywords: Bayesian inference; phylodynamics; phylogenetics; population structure.
Conflict of interest statement
The authors declare no conflict of interest. The funders had no role in the design of the study; in the collection, analyses, or interpretation of data; in the writing of the manuscript, or in the decision to publish the results.
Figures
Similar articles
-
ReMASTER: improved phylodynamic simulation for BEAST 2.7.Bioinformatics. 2024 Jan 2;40(1):btae015. doi: 10.1093/bioinformatics/btae015. Bioinformatics. 2024. PMID: 38195927 Free PMC article.
-
MASCOT: parameter and state inference under the marginal structured coalescent approximation.Bioinformatics. 2018 Nov 15;34(22):3843-3848. doi: 10.1093/bioinformatics/bty406. Bioinformatics. 2018. PMID: 29790921 Free PMC article.
-
Inferring time-dependent migration and coalescence patterns from genetic sequence and predictor data in structured populations.Virus Evol. 2019 Aug 14;5(2):vez030. doi: 10.1093/ve/vez030. eCollection 2019 Jul. Virus Evol. 2019. PMID: 31428459 Free PMC article.
-
Towards a new paradigm linking virus molecular evolution and pathogenesis: experimental design and phylodynamic inference.New Microbiol. 2012 Apr;35(2):101-11. Epub 2012 Mar 31. New Microbiol. 2012. PMID: 22707126 Review.
-
Epidemiological inference from pathogen genomes: A review of phylodynamic models and applications.Virus Evol. 2022 Jun 2;8(1):veac045. doi: 10.1093/ve/veac045. eCollection 2022. Virus Evol. 2022. PMID: 35775026 Free PMC article. Review.
Cited by
-
How to Validate a Bayesian Evolutionary Model.Syst Biol. 2025 Feb 10;74(1):158-175. doi: 10.1093/sysbio/syae064. Syst Biol. 2025. PMID: 39506375 Free PMC article.
-
Fast and Accurate Maximum-Likelihood Estimation of Multi-Type Birth-Death Epidemiological Models from Phylogenetic Trees.Syst Biol. 2023 Dec 30;72(6):1387-1402. doi: 10.1093/sysbio/syad059. Syst Biol. 2023. PMID: 37703335 Free PMC article.
-
Inferring HIV transmission patterns from viral deep-sequence data via latent typed point processes.Biometrics. 2024 Jan 29;80(1):ujad015. doi: 10.1093/biomtc/ujad015. Biometrics. 2024. PMID: 38372402 Free PMC article.
-
Bayesian Phylodynamic Inference of Multitype Population Trajectories Using Genomic Data.Mol Biol Evol. 2025 Jun 4;42(6):msaf130. doi: 10.1093/molbev/msaf130. Mol Biol Evol. 2025. PMID: 40458956 Free PMC article.
-
Disentangling the role of poultry farms and wild birds in the spread of highly pathogenic avian influenza virus in Europe.Virus Evol. 2022 Aug 18;8(2):veac073. doi: 10.1093/ve/veac073. eCollection 2022. Virus Evol. 2022. PMID: 36533150 Free PMC article.
References
Publication types
MeSH terms
Grants and funding
LinkOut - more resources
Full Text Sources
Miscellaneous
