

Serum SARS-CoV-2 Antigens for the Determination of COVID-19 Severity
- PMID: 36016276
- PMCID: PMC9415151
- DOI: 10.3390/v14081653
Serum SARS-CoV-2 Antigens for the Determination of COVID-19 Severity
Abstract
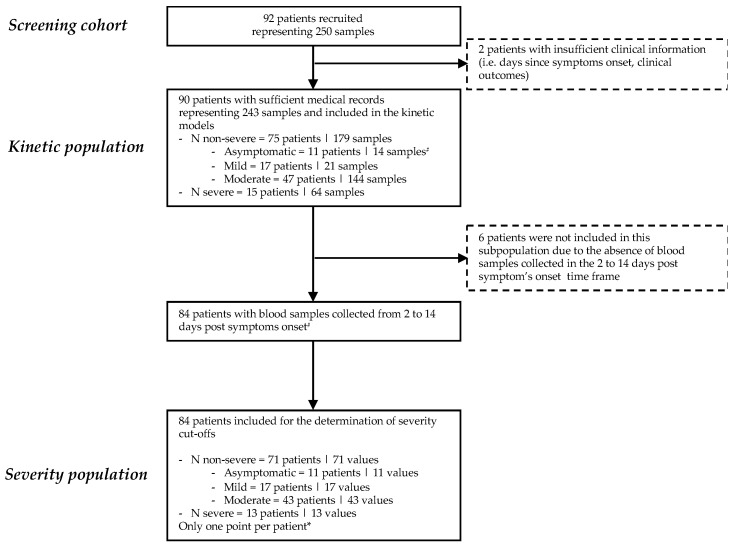
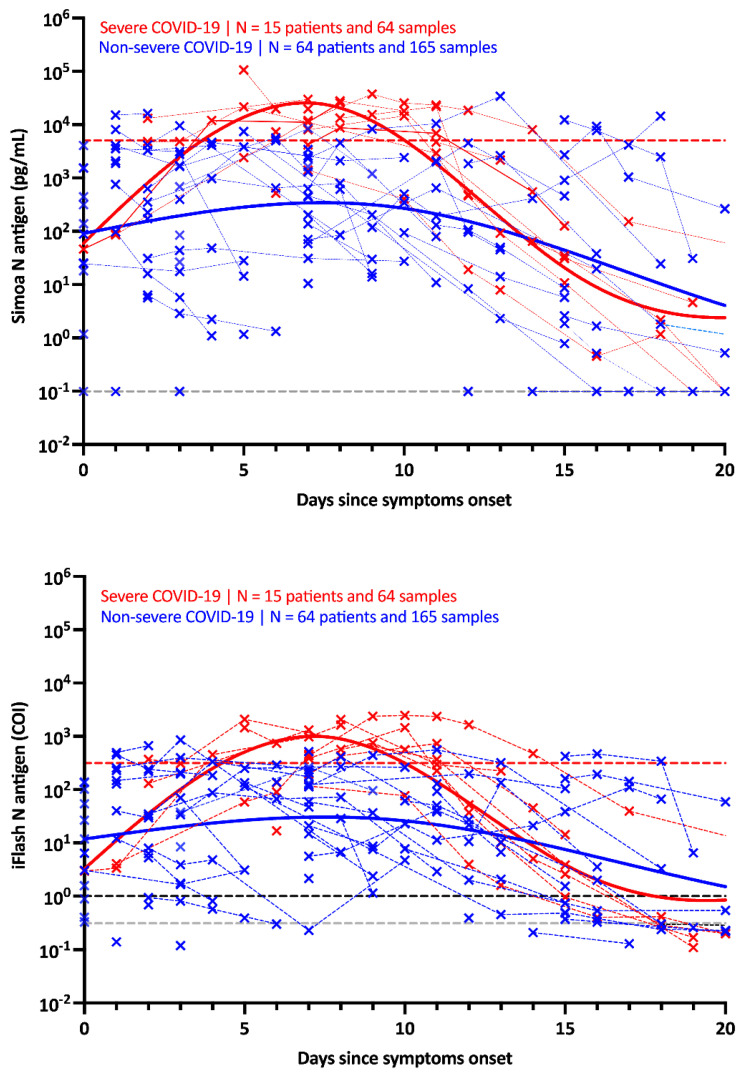
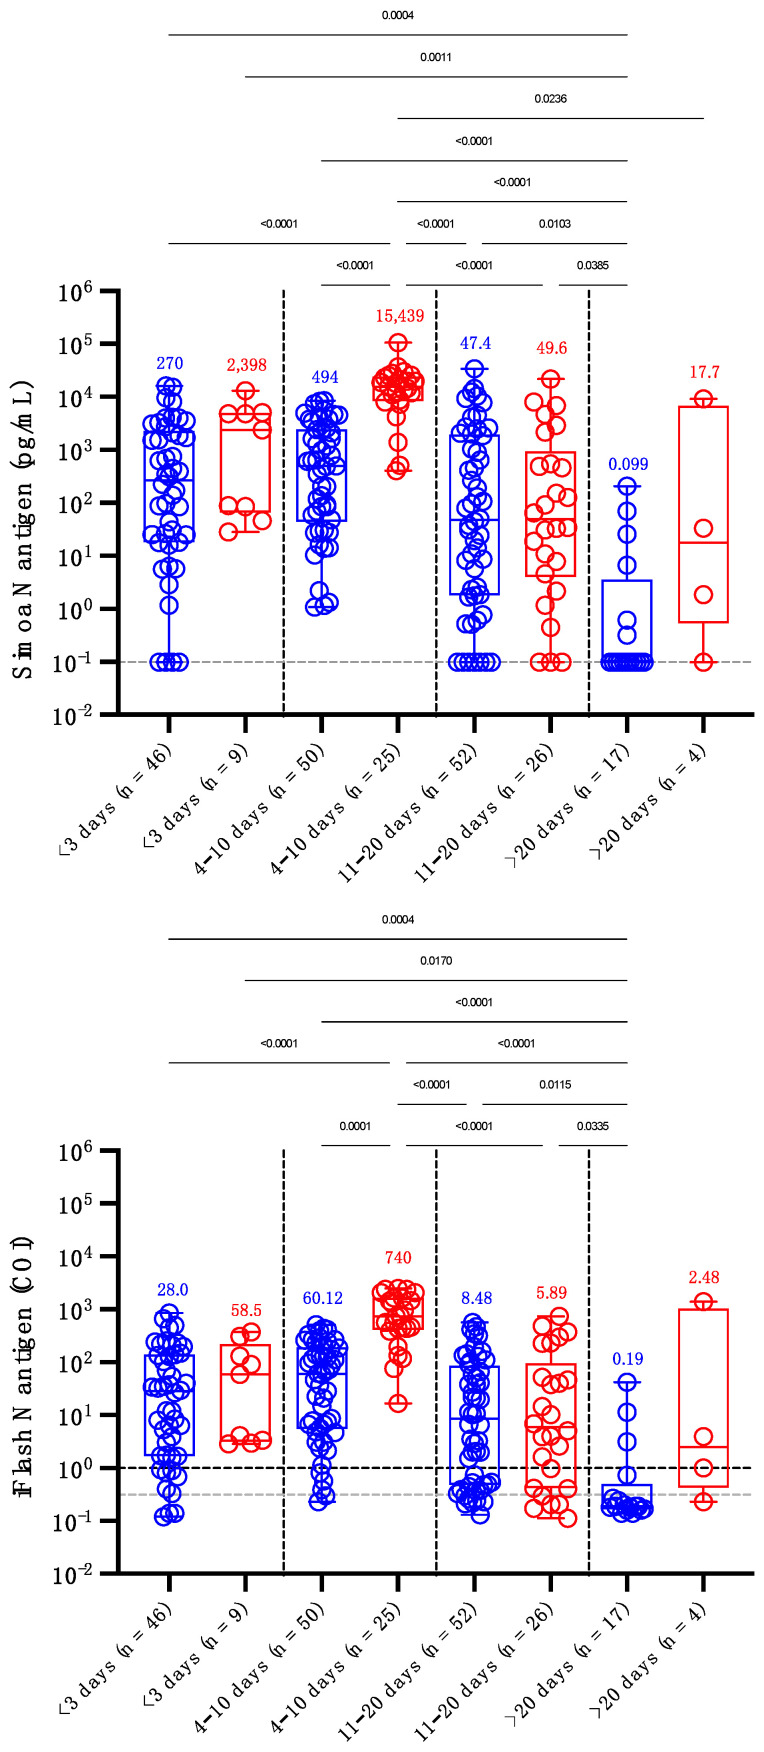
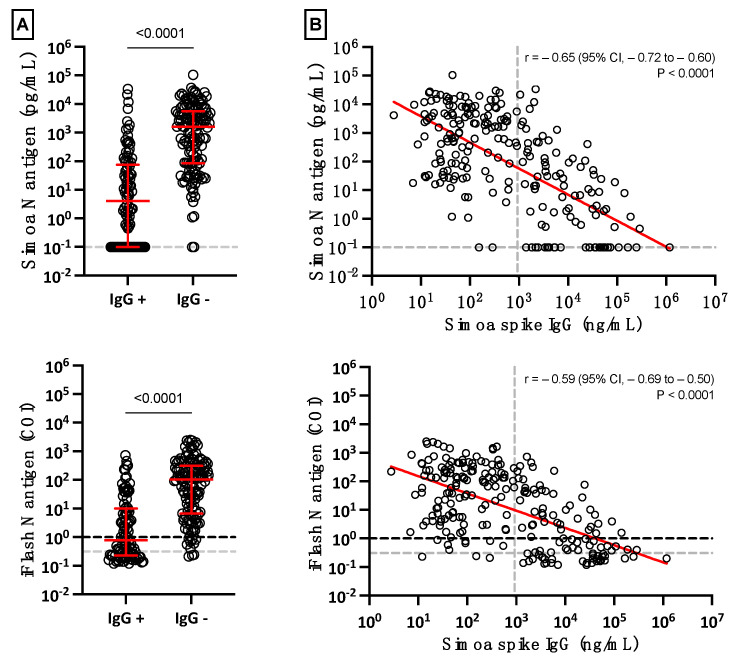
The diagnostic of SARS-CoV-2 infection relies on reverse transcriptase polymerase chain reactions (RT-PCRs) performed on nasopharyngeal (NP) swabs. Nevertheless, false-negative results can be obtained with inadequate sampling procedures, making the use of other biological matrices worthy of investigation. This study aims to evaluate the kinetics of serum N antigens in severe and non-severe patients and compare the clinical performance of serum antigenic assays with NP RT-PCR. Ninety patients were included in the study and monitored for several days. Disease severity was determined according to the WHO clinical progression scale. Serum N antigen levels were measured with a chemiluminescent assay (CLIA) and the Single Molecular Array (Simoa) assay. Viremia thresholds for severity were determined and proposed. In severe patients, the peak antigen response was observed 7 days after the onset of symptoms, followed by a decline. No real peak response was observed in non-severe patients. Severity thresholds for the Simoa and the CLIA provided positive likelihood ratios of 30.0 and 10.9 for the timeframe between day 2 and day 14, respectively. Sensitive detection of N antigens in serum may thus provide a valuable new marker for COVID-19 diagnosis and evaluation of disease severity. When assessed during the first 2 weeks since the onset of symptoms, it may help in identifying patients at risk of developing severe COVID-19 to optimize better intensive care utilization.
Keywords: COVID-19; RT-PCR; SARS-CoV-2; antigenic assay; prognosis test.
Conflict of interest statement
Among the authors, J.D. is the CEO and founder of QUALIblood s.a., a contract research organization manufacturing the DP-Filter; coinventor of the DP-Filter (patent application number: PCT/ET2019/ 052903) and reports personal fees from Daiichi-Sankyo, DOASense, Gedeon Richter, Mithra Pharmaceuticals, Norgine, Portola, Stago, Roche, Roche Diagnostics, Werfen and YHLO Biotech.
Figures
References
-
- Bohn M.K., Lippi G., Horvath A., Sethi S., Koch D., Ferrari M., Wang C.B., Mancini N., Steele S., Adeli K. Molecular, serological, and biochemical diagnosis and monitoring of COVID-19: IFCC taskforce evaluation of the latest evidence. Clin. Chem. Lab. Med. 2020;58:1037–1052. doi: 10.1515/cclm-2020-0722. - DOI - PubMed
-
- Quanterix Simoa® SARS-CoV-2 N Protein Antigen Test—Instruction for Use (IFU 0002) 2021. [(accessed on 23 July 2022)]. Available online: https://www.quanterix.com/simoa-assay-kits/sars-cov-2-n-protein-antigen/
-
- Favresse J., Gillot C., Oliveira M., Cadrobbi J., Elsen M., Eucher C., Laffineur K., Rosseels C., van Eeckhoudt S., Nicolas J.B., et al. Head-to-Head Comparison of Rapid and Automated Antigen Detection Tests for the Diagnosis of SARS-CoV-2 Infection. J. Clin. Med. 2021;10:265. doi: 10.3390/jcm10020265. - DOI - PMC - PubMed
-
- Ogata A.F., Maley A.M., Wu C., Gilboa T., Norman M., Lazarovits R., Mao C.P., Newton G., Chang M., Nguyen K., et al. Ultra-Sensitive Serial Profiling of SARS-CoV-2 Antigens and Antibodies in Plasma to Understand Disease Progression in COVID-19 Patients with Severe Disease. Clin. Chem. 2020;66:1562–1572. doi: 10.1093/clinchem/hvaa213. - DOI - PMC - PubMed
-
- Chen H., Li Z., Feng S., Richard-Greenblatt M., Hutson E., Andrianus S., Glaser L.J., Rodino K.G., Qian J., Jayaraman D., et al. Femtomolar SARS-CoV-2 Antigen Detection Using the Microbubbling Digital Assay with Smartphone Readout Enables Antigen Burden Quantitation and Tracking. Clin. Chem. 2021;68:230–239. doi: 10.1093/clinchem/hvab158. - DOI - PMC - PubMed
Publication types
MeSH terms
LinkOut - more resources
Full Text Sources
Medical
Miscellaneous
