. 2022 Aug 22;14(8):1839.
doi: 10.3390/v14081839.

Chikungunya Virus E2 Structural Protein B-Cell Epitopes Analysis

Affiliations

Chikungunya Virus E2 Structural Protein B-Cell Epitopes Analysis

João Paulo da Cruz Silva et al. Viruses. .

Abstract

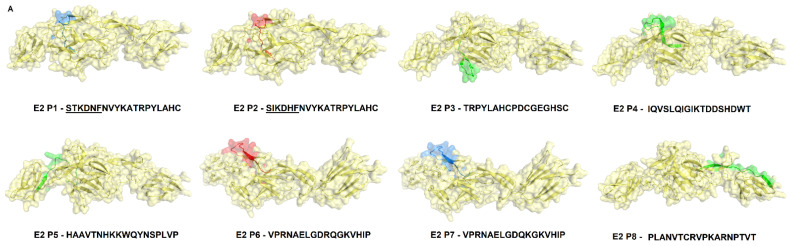
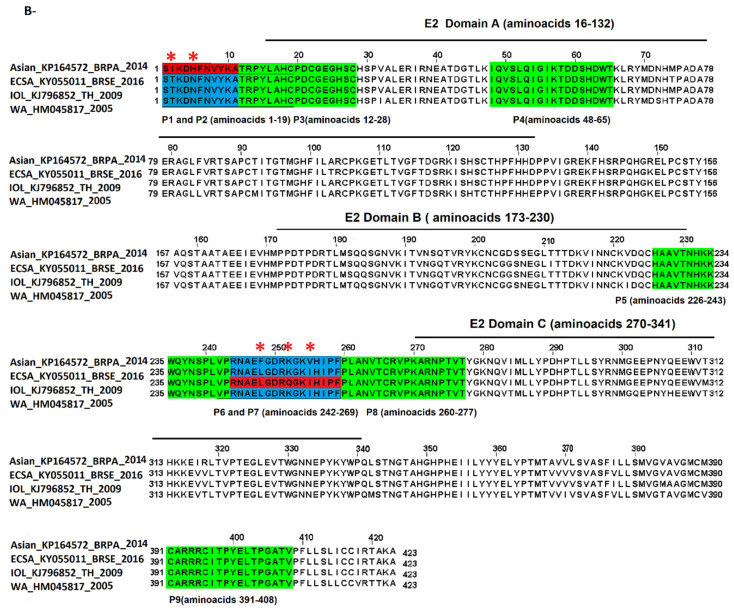
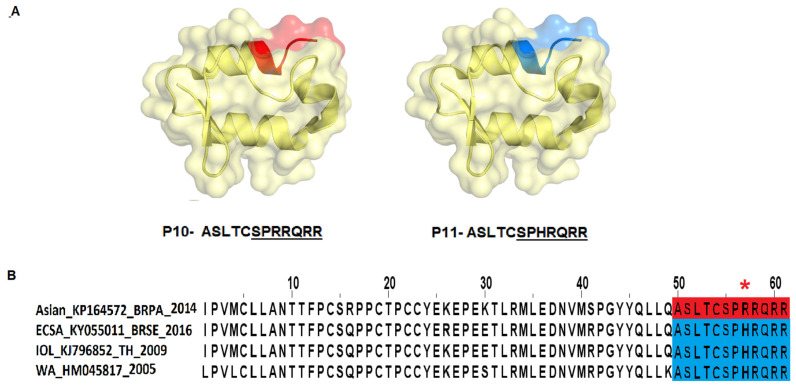
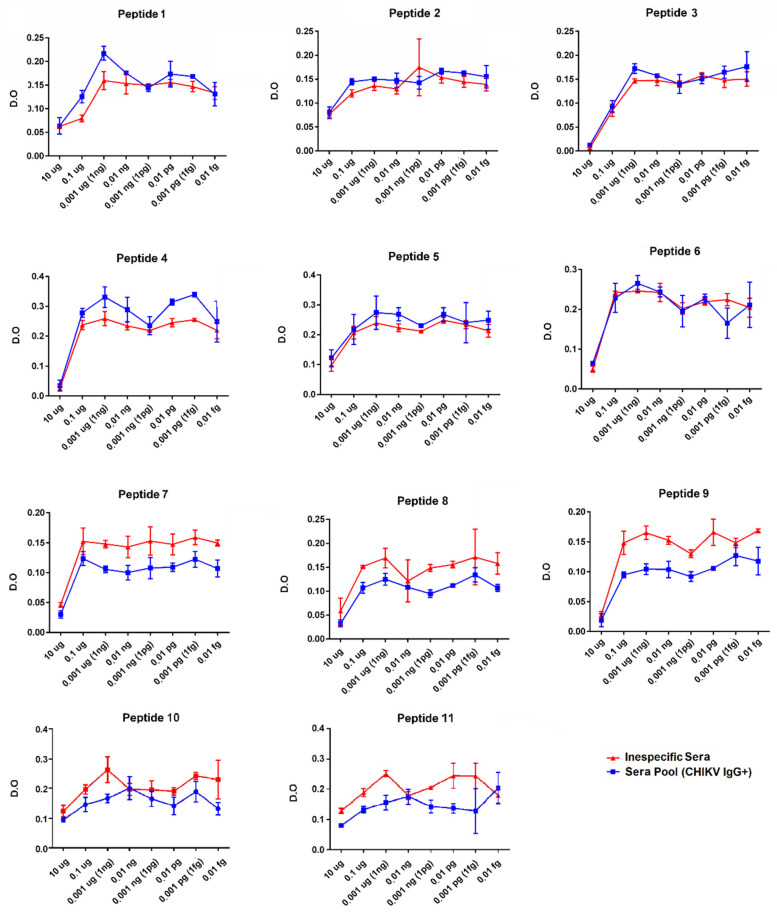
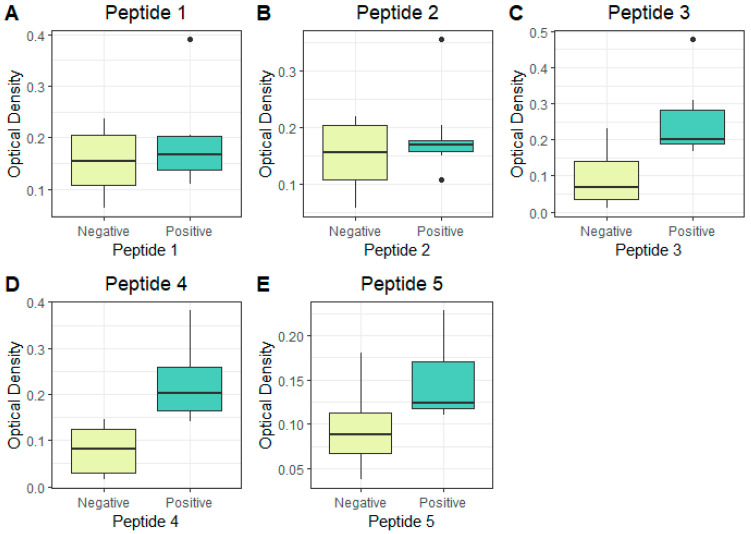
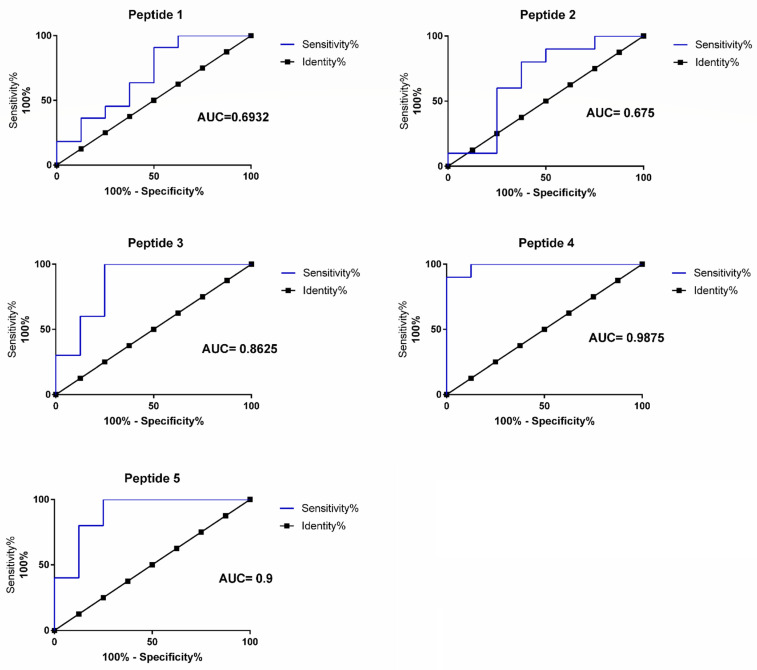
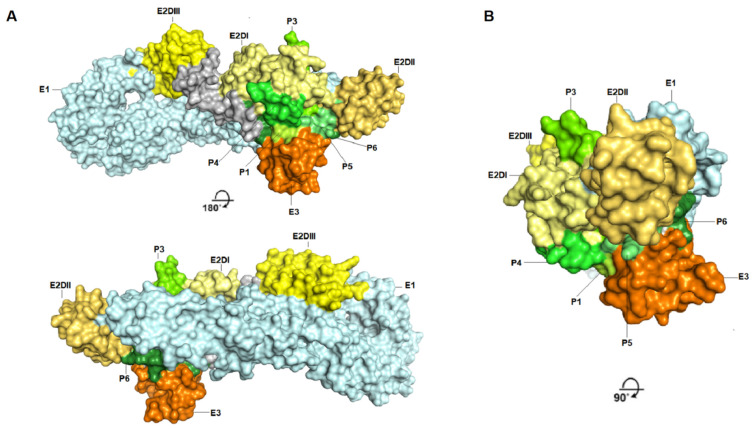
The Togaviridae family comprises a large and diverse group of viruses responsible for recurrent outbreaks in humans. Within this family, the Chikungunya virus (CHIKV) is an important Alphavirus in terms of morbidity, mortality, and economic impact on humans in different regions of the world. The objective of this study was to perform an IgG epitope recognition of the CHIKV's structural proteins E2 and E3 using linear synthetic peptides recognized by serum from patients in the convalescence phase of infection. The serum samples used were collected in the state of Sergipe, Brazil in 2016. Based on the results obtained using immunoinformatic predictions, synthetic B-cell peptides corresponding to the epitopes of structural proteins E2 and E3 of the CHIKV were analyzed by the indirect peptide ELISA technique. Protein E2 was the main target of the immune response, and three conserved peptides, corresponding to peptides P3 and P4 located at Domain A and P5 at the end of Domain B, were identified. The peptides P4 and P5 were the most reactive and specific among the 11 epitopes analyzed and showed potential for use in serological diagnostic trials and development and/or improvement of the Chikungunya virus diagnosis and vaccine design.

Keywords: B-cell epitopes; Chikungunya virus; ELISA; immunoinformatics; peptides.


Conflict of interest statement

Not applicable.

Figures

Figure 1
Figure 1
Phylogenetic tree representing the genotypes of the Chikungunya virus. The Chikungunya virus phylogenetic reconstruction, with 63 complete genome sequences. The green color is the WA genotype (West African), the blue color is the Asian genotype, the violet color is the ECSA genotype (East-Central-South African), and the gray color is the IOL lineage. The present values close to the main knots represent the bootstrap values.
Figure 2
Figure 2
Chikungunya virus E2 Protein antigenicity (A) and linear (B) and conformational (C) epitopes’ prediction. The blue line represents the mean value, and the yellow line represents the standard deviation value. In general, the places where only yellow appears are regions with a very small standard deviation and probably conserved regions among the CHIKV genotypes, and where blue appears, they correspond to regions with a higher standard deviation and probably variable or semi-conserved regions among all four CHIKV genotypes.
Figure 3
Figure 3
Chikungunya virus E3 Protein antigenicity (A) and linear (B) and conformational (C) epitopes’ prediction. The blue line represents the mean value, and the yellow line represents the standard deviation value. In general, the places where only yellow appears are regions with a very small standard deviation and probably conserved regions among the CHIKV genotypes, and where blue appears, they correspond to regions with a higher standard deviation and probably variable or semi-conserved regions among all four CHIKV genotypes.
Figure 4
Figure 4
Synthetic peptides are highlighted on the E2 Protein structure and multiple sequence alignment. On top (A), predicted epitopes are highlighted on the structure of the protein E2. (B), Multiple alignment of E2 protein sequences corresponding to the four genotypes with highlighted peptides. In green, epitopes are conserved among all genotypes. In blue, epitopes are common to more than one genotype. In red are the single epitopes of each genotype. *—Amino acid changes in the regions predicted as epitopes. Underlined amino acids in peptides’ sequences corresponding to regions not resolved in the crystallography structure.
Figure 4
Figure 4
Synthetic peptides are highlighted on the E2 Protein structure and multiple sequence alignment. On top (A), predicted epitopes are highlighted on the structure of the protein E2. (B), Multiple alignment of E2 protein sequences corresponding to the four genotypes with highlighted peptides. In green, epitopes are conserved among all genotypes. In blue, epitopes are common to more than one genotype. In red are the single epitopes of each genotype. *—Amino acid changes in the regions predicted as epitopes. Underlined amino acids in peptides’ sequences corresponding to regions not resolved in the crystallography structure.
Figure 5
Figure 5
Synthetic peptides are highlighted on the E3 Protein structure and multiple sequence alignment. On top, (A) the predicted epitopes are highlighted on the structure of protein E3. (B), The multiple alignment of the E3 protein sequences corresponding to the four genotypes with highlighted peptides. Blue epitopes are common to more than one genotype. In red are the single epitope for individual genotype. *—Amino acid changes in the regions predicted as epitopes. Underlined amino acids in the peptides’ sequences corresponding to regions not resolved in the crystallography structure.
Figure 6
Figure 6
Standardization results of the indirect immunoenzyme peptide assay. A—The peptides P1–P9 correspond to the E2 protein. The peptides P10 and P11 correspond to the E3 protein. On the Y-axis, the optical density (O.D.) measurements for the positive IgG CHIKV patient sera pool (blue line) and, as the control, a non-specific IgG human serum (red line). On the X-axis the antigen dilutions. All assays were performed in sample triplicates.
Figure 7
Figure 7
Protein E2 peptides’ P1 (A), P2 (B), P3 (C), P4 (D), and P5 (E) reactivity using individual sera samples. Boxplots in yellow represent the CHIKV IgG negative sera, and green boxplots represent the CHIKV positive-IgG patients. The experiments were all performed in sample triplicates. The following cut-off value was established as the comparison threshold; mean of the triplicates +2x the standard deviation.
Figure 8
Figure 8
ROC curve for E2 protein synthetic peptides P1 to P5. 95% confidence interval. The peptides’, P1 to P5, potential as classifiers was analyzed by the Receiving Operating Curve analysis. On the x-axis specificity score and the y-axis sensitivity score, the black dotted line represents the identity score, and the blue line represents the sensitivity score. The AUC (Area Under the Curve) score is shown for the individual peptides.
Figure 9
Figure 9
Antigenic and immunogenic B-cell epitopes are highlighted on the Chikungunya virus’ glycoprotein envelope structural organization. (A) The Chikungunya virus’ glycoprotein envelope complex structure’s surface (PDB:3N43); protein E1 is in light blue; protein E2, Domains I, II, and III are in pale yellow, yellow-orange, and light yellow, respectively; and protein E3 is in orange. Epitopes corresponding to peptides P1, P3, P4, P5, and P6 in protein E2 are highlighted in green tones. (B) The upper view from (A).

References

    1. Powers A.N.N.M., Brault A.C., Shirako Y., Strauss E.G., Kang W., Strauss J.H., Weaver S.C. Evolutionary Relationships and Systematics of the Alphaviruses. Am. Soc. Microbiol. 2001;75:10118–10131. doi: 10.1128/JVI.75.21.10118-10131.2001. - DOI - PMC - PubMed
    1. Weaver S.C., Forrester N.L. Chikungunya: Evolutionary history and recent epidemic spread. Antivir. Res. 2015;120:32–39. doi: 10.1016/j.antiviral.2015.04.016. - DOI - PubMed
    1. Development C.V. A Review on Chikungunya Virus Epidemiology, Pathogenesis and Current Vaccine Development. Viruses. 2022;14:969. - PMC - PubMed
    1. Weaver S.C. Arrival of Chikungunya Virus in the New World: Prospects for Spread and Impact on Public Health. PLoS Negl. Trop. Dis. 2014;8:e2921. doi: 10.1371/journal.pntd.0002921. - DOI - PMC - PubMed
    1. Nunes M.R.T., Faria N.R., De Vasconcelos J.M., Golding N., Kraemer M.U.G., de Oliveira L.F., Azevedo S., Coelho G.E., Cecília A., Cruz R., et al. Emergence and potential for spread of Chikungunya virus in Brazil Emergence and potential for spread of Chikungunya virus in Brazil. BMC Med. 2015;13:102. doi: 10.1186/s12916-015-0348-x. - DOI - PMC - PubMed

Publication types