Meta-Analysis
. 2022 Nov;55(11):553-558.
doi: 10.5483/BMBRep.2022.55.11.110.

Methylation-sensitive high-resolution melting analysis of the USP44 promoter can detect early-stage hepatocellular carcinoma in blood samples

Affiliations
Meta-Analysis

Methylation-sensitive high-resolution melting analysis of the USP44 promoter can detect early-stage hepatocellular carcinoma in blood samples

Si-Cho Kim et al. BMB Rep. 2022 Nov.

Abstract

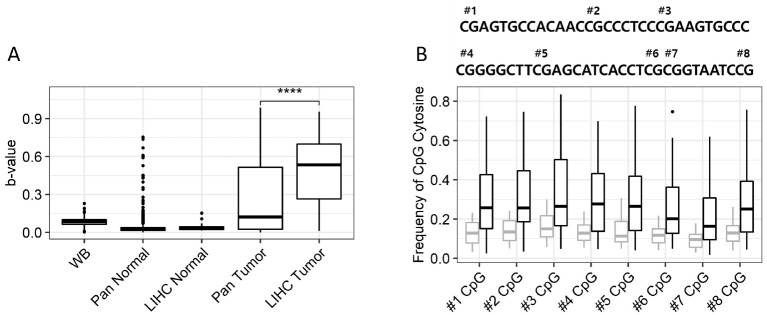
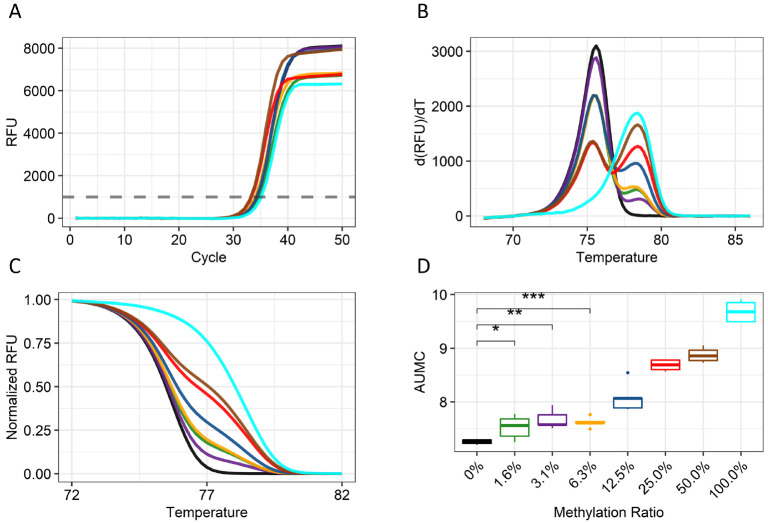
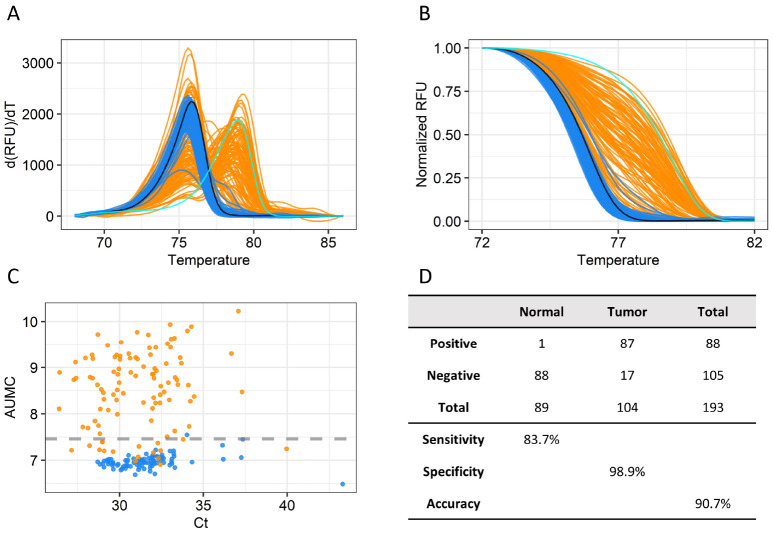
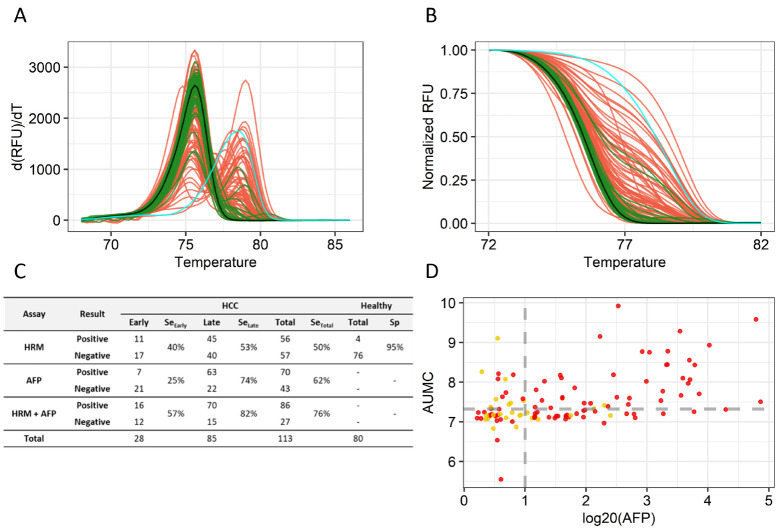
Hepatocellular carcinoma (HCC) is dangerous cancer that often evades early detection because it is asymptomatic and an effective detection method is lacking. For people with chronic liver inflammation who are at high risk of developing HCC, a sensitive detection method for HCC is needed. In a meta-analysis of The Cancer Genome Atlas pan-cancer methylation database, we identified a CpG island in the USP44 promoter that is methylated specifically in HCC. We developed methylation-sensitive high-resolution melting (MS-HRM) analysis to measure the methylation levels of the USP promoter in cell-free DNA isolated from patients. Our MS-HRM assay correctly identified 40% of patients with early-stage HCC, whereas the α-fetoprotein test, which is currently used to detect HCC, correctly identified only 25% of early-stage HCC patients. These results demonstrate that USP44 MS-HRM analysis is suitable for HCC surveillance. [BMB Reports 2022; 55(11): 553-558].


Conflict of interest statement

CONFLICTS OF INTEREST

The authors have no conflicting interests.

Figures

Fig. 1
Fig. 1
Methylation of cg22538054 in normal and tumor tissues. (A) The b-value of cg22538054 in public data collected from TCGA, GEO, and KNIH. WB; whole blood, LIHC; liver hepatocellular carcinoma. ****P < 0.0001. (B) Results of pyrosequencing analysis of eight CpG sites including cg22538054 at the USP44 promoter. The sequence of the USP44 promoter region, with CpG sites labeled “#number”, is shown at the top. Boxplot shows the cytosine frequencies of normal (gray) and tumor (black) tissues at CpG sites corresponding to the “#number” label shown above. ****P < 0.0001.
Fig. 2
Fig. 2
Melting peak and curve analysis of the cg22538054 MS-HRM assay. (A) Relative fluorescence units (RFUs) values of the amplification for samples with increasing levels of methylation. (B) Melting peak plot of each serially diluted sample at the indicated temperature. The melting peak is derived by taking a negative number to the differential value of the melting curve. (C) A normalized melting curve plot of each serially diluted sample is shown. (D) A boxplot of the AUMC values of the curves of serially diluted samples based on the normalized melting curve. The experiment was done a total of five times. The color codes for the methylated templates are as follows: 0%, black; 1.56%, green; 3.12%, dark orchid; 6.25%, orange; 12.5%, blue; 25.0%, red; 50.0%, brown; and 100%, cyan.
Fig. 3
Fig. 3
MS-HRM assay of HCC tumor and paired normal tissue samples. (A) Melting peak plot of NAT and tumor tissue samples in the indicated temperature range. The color codes are as follows: negative control, black; positive control, cyan; NAT, blue; and tumor tissue, orange. (B) Normalized melting curve plot of NAT and tumor tissue samples. (C) Scatter plots for Cq and AUMC of each tissue sample. The gray dotted line indicates the 99th percentile of AUMC values of NATs. (D) Accuracy of the MS-HRM assay. Sensitivity and specificity are based on a cut-off set to the 99th percentile of AUMC values (7.463) of NATs.
Fig. 4
Fig. 4
MS-HRM assay for blood samples from 80 healthy people and 113 HCC patients. (A) Melting peak plot. The color codes are as follows: negative control, black; positive control, cyan; healthy people, green; and HCC patients, red. (B) Normalized melting curve plot. (C) Diagnostic performance of the MS-HRM assay and AFP test. (D) Scatter plots of AFP and AUMC values for tumor stage (early-stage: BCLC 0, A (yellow dot); late-stage: BCLC B, C, D (red dot)). AFP values were converted to log20. The gray dotted line on the y-axis represents the 95th percentile (7.325) of AUMC values of healthy people, and the gray dotted line on the x-axis sets indicates the tumor cut-off point where log20 (AFP) is 1.

Similar articles

Cited by

References

    1. Rahib L, Smith BD, Aizenberg R, et al. Projecting cancer incidence and deaths to 2030: the unexpected burden of thyroid, liver, and pancreas cancers in the United States. Cancer Res. 2014;74:2913–2921. doi: 10.1158/0008-5472.CAN-14-0155. - DOI - PubMed
    1. Tzartzeva K, Obi J, Rich NE, et al. Surveillance imaging and alpha fetoprotein for early detection of hepatocellular carcinoma in patients with cirrhosis: a meta-analysis. Gastroenterology. 2018;154:1706–1718. doi: 10.1053/j.gastro.2018.01.064. - DOI - PMC - PubMed
    1. Kang I, Kim JA, Kim J, Lee JH, Kim MJ, Ahn JK. Hepatitis B virus X protein promotes epithelial-mesenchymal transition of hepatocellular carcinoma cells by regulating SOCS1. BMB Rep. 2022;55:220. doi: 10.5483/BMBRep.2022.55.5.157. - DOI - PMC - PubMed
    1. D'Intino PE, Morselli-Labate AM, et al. Trevisani F', author. Serum α-fetoprotein for diagnosis of hepatocellular carcinoma in patients with chronic liver disease: influence of HBsAg and anti-HCV status. J Hepatol. 2001;34:570–575. doi: 10.1016/S0168-8278(00)00053-2. - DOI - PubMed
    1. Akinyemiju T, Abera S, Ahmed M, et al. The burden of primary liver cancer and underlying etiologies from 1990 to 2015 at the global, regional, and national level: results from the global burden of disease study 2015. JAMA Oncol. 2017;3:1683–1691. doi: 10.1001/jamaoncol.2017.3055. - DOI - PMC - PubMed

MeSH terms