

Gut microbiomes of cyprinid fish exhibit host-species symbiosis along gut trait and diet
- PMID: 36016786
- PMCID: PMC9396210
- DOI: 10.3389/fmicb.2022.936601
Gut microbiomes of cyprinid fish exhibit host-species symbiosis along gut trait and diet
Abstract
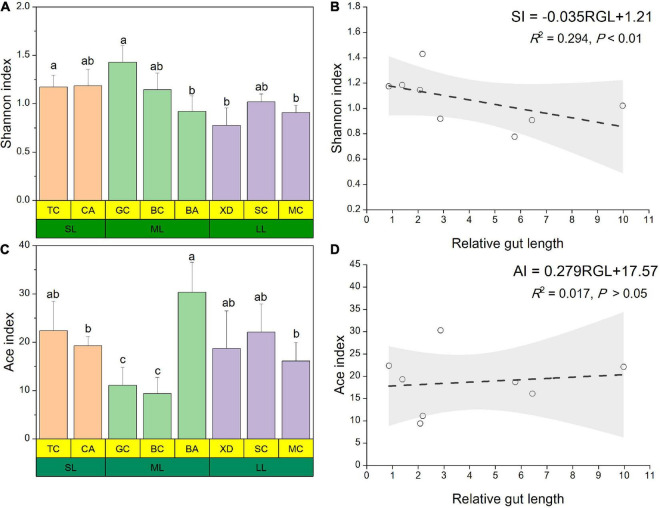
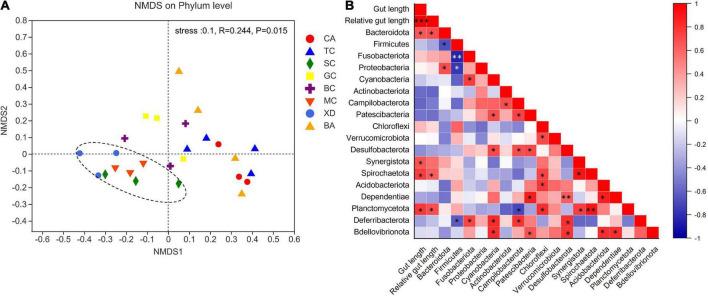
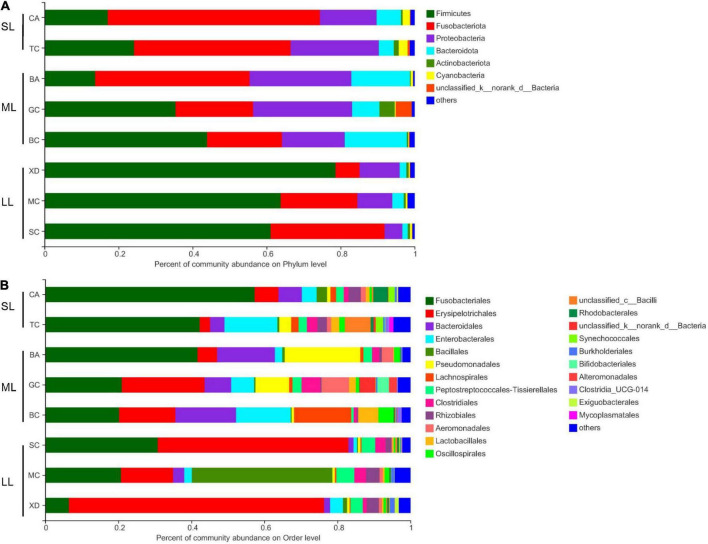
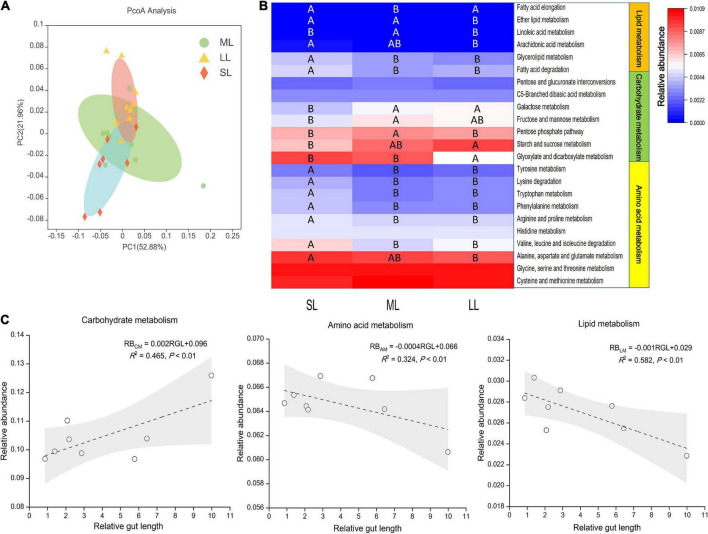
Teleost omnivorous fish that coexist partially sharing resources are likely to modify their gut traits and microbiome as a feedback mechanism between ecological processes and evolution. However, we do not understand how the core gut microbiome supports the metabolic capacity of the host and regulates digestive functions in specialized omnivorous fish gut traits. Therefore, we evaluated the gut microbiome of eight omnivorous fish from a single family (i.e., Cyprinidae) in the current study. We examined the correlation between host phylogeny, diet composition, and intestinal morphological traits related to the intestinal microbiome. The results indicated that cyprinid fish with similar relative gut lengths had considerable gut microbiome similarity. Notably, the SL (short relative gut length) group, as zoobenthos and zooplankton specialists, was abundant in Proteobacteria and was less abundant in Firmicutes than in the ML (medium relative gut length) and LL (long relative gut length) groups. These fish could extract nutrients from aquatic plants and algae. Additionally, we found the relative abundance of Clostridium and Romboutsia to be positively correlated with host relative gut length but negatively correlated with the relative abundance of Cetobacterium, Plesiomonas, Bacteroides, and Lactobacillus, and host-relative gut length. We also show a positive linear relationship between host gut microbiome carbohydrate metabolism and relative gut length, while the amino acid and lipid metabolism of the gut microbiome was negatively correlated with host-relative gut length. In addition, omnivorous species competing for resources improve their ecological adaptability through the specialization of gut length, which is closely related to variation in the synergy of the gut microbiome. Above all, specialized gut microbiota and associated gut morphologies enable fish to variably tolerate resource fluctuation and improve the utilization efficiency of nutrient extraction from challenging food resources.
Keywords: Cyprinidae; coexistence; gut length; gut microbiome; metabolism.
Copyright © 2022 Liu, Li, Li, Li and Zhu.
Conflict of interest statement
The authors declare that the research was conducted in the absence of any commercial or financial relationships that could be construed as a potential conflict of interest.
Figures


Similar articles
-
Phylosymbiosis across Deeply Diverging Lineages of Omnivorous Cockroaches (Order Blattodea).Appl Environ Microbiol. 2020 Mar 18;86(7):e02513-19. doi: 10.1128/AEM.02513-19. Print 2020 Mar 18. Appl Environ Microbiol. 2020. PMID: 31953337 Free PMC article.
-
The Core Gut Microbiome of the American Cockroach, Periplaneta americana, Is Stable and Resilient to Dietary Shifts.Appl Environ Microbiol. 2016 Oct 27;82(22):6603-6610. doi: 10.1128/AEM.01837-16. Print 2016 Nov 15. Appl Environ Microbiol. 2016. PMID: 27590811 Free PMC article.
-
Comparison of Channel Catfish and Blue Catfish Gut Microbiota Assemblages Shows Minimal Effects of Host Genetics on Microbial Structure and Inferred Function.Front Microbiol. 2018 May 23;9:1073. doi: 10.3389/fmicb.2018.01073. eCollection 2018. Front Microbiol. 2018. PMID: 29875764 Free PMC article.
-
Host-microbiome interaction in fish and shellfish: An overview.Fish Shellfish Immunol Rep. 2023 Mar 31;4:100091. doi: 10.1016/j.fsirep.2023.100091. eCollection 2023 Dec. Fish Shellfish Immunol Rep. 2023. PMID: 37091066 Free PMC article. Review.
-
The potential role of the gut microbiota in shaping host energetics and metabolic rate.J Anim Ecol. 2020 Nov;89(11):2415-2426. doi: 10.1111/1365-2656.13327. Epub 2020 Sep 28. J Anim Ecol. 2020. PMID: 32858775 Review.
Cited by
-
Gut Microbial Composition of Cyprinella lutrensis (Red Shiner) and Notropis stramineus (Sand Shiner): Insights from Wild Fish Populations.Microb Ecol. 2024 May 22;87(1):75. doi: 10.1007/s00248-024-02386-z. Microb Ecol. 2024. PMID: 38775958 Free PMC article.
-
Variable phylosymbiosis and cophylogeny patterns in wild fish gut microbiota of a large subtropical river.mSphere. 2025 Apr 29;10(4):e0098224. doi: 10.1128/msphere.00982-24. Epub 2025 Mar 28. mSphere. 2025. PMID: 40152595 Free PMC article.
-
Gut Microbiota Contribute to Heterosis for Growth Trait and Muscle Nutrient Composition in Hybrid Largemouth Bass (Micropterus salmoides).Microorganisms. 2025 Jun 22;13(7):1449. doi: 10.3390/microorganisms13071449. Microorganisms. 2025. PMID: 40731959 Free PMC article.
-
Comparative metagenomics of tropical reef fishes show conserved core gut functions across hosts and diets with diet-related functional gene enrichments.Appl Environ Microbiol. 2025 Feb 19;91(2):e0222924. doi: 10.1128/aem.02229-24. Epub 2025 Jan 22. Appl Environ Microbiol. 2025. PMID: 39840973 Free PMC article.
-
Fish Gut Microbiome Analysis Provides Insight into Differences in Physiology and Behavior of Invasive Nile Tilapia and Indigenous Fish in a Large Subtropical River in China.Animals (Basel). 2023 Jul 26;13(15):2413. doi: 10.3390/ani13152413. Animals (Basel). 2023. PMID: 37570222 Free PMC article.
References
-
- Bjursell M., Admyre T., Göransson M., Marley A. E., Smith D. M., Oscarsson J., et al. (2011). Improved glucose control and reduced body fat mass in free fattyacid receptor 2-deficient mice fed a high-fat diet. Am. J. Physiol. Endocrinol. Metab. 300 E211–E220. 10.1152/ajpendo.00229.2010 - DOI - PubMed
-
- Clarke K. R. (1993). Non-parametric multivariate analyses of changes in community structure. Aust. J. Ecol. 18 117–143. 10.1111/j.1442-9993.1993.tb00438.x - DOI
LinkOut - more resources
Full Text Sources