

Investigation of Gynura segetum root extract (GSrE) induced hepatotoxicity based on metabolomic signatures and microbial community profiling in rats
- PMID: 36016788
- PMCID: PMC9396145
- DOI: 10.3389/fmicb.2022.947757
Investigation of Gynura segetum root extract (GSrE) induced hepatotoxicity based on metabolomic signatures and microbial community profiling in rats
Abstract
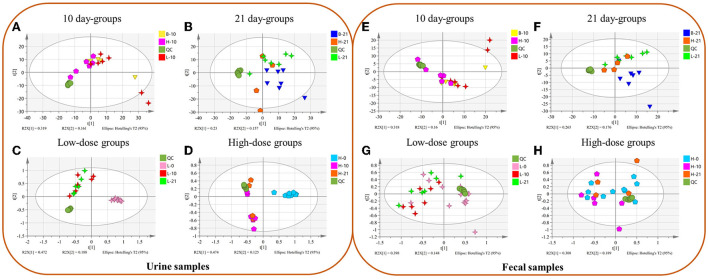
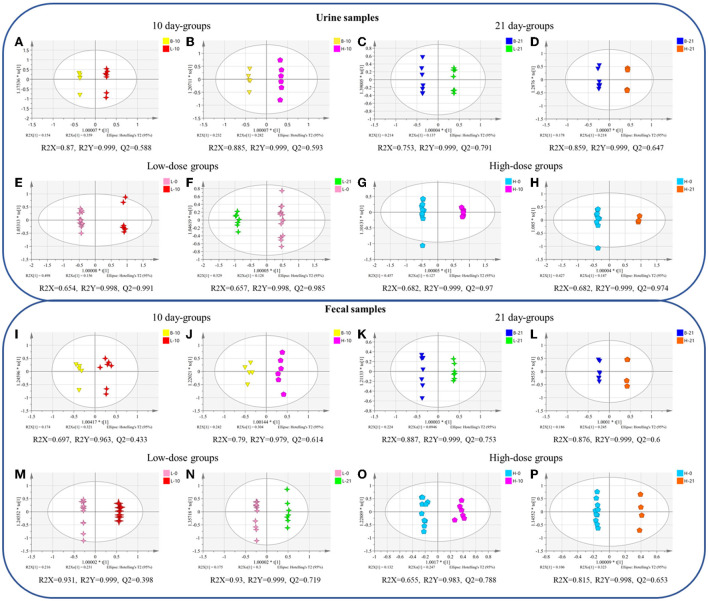
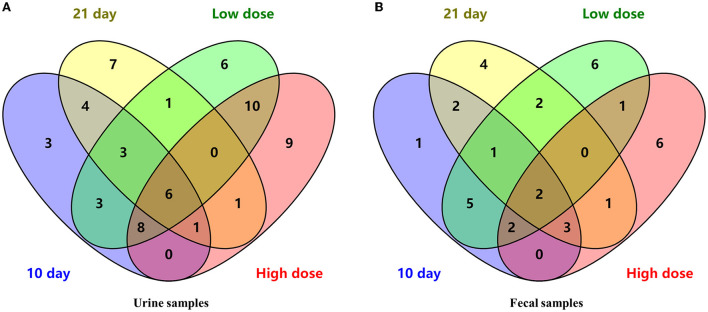
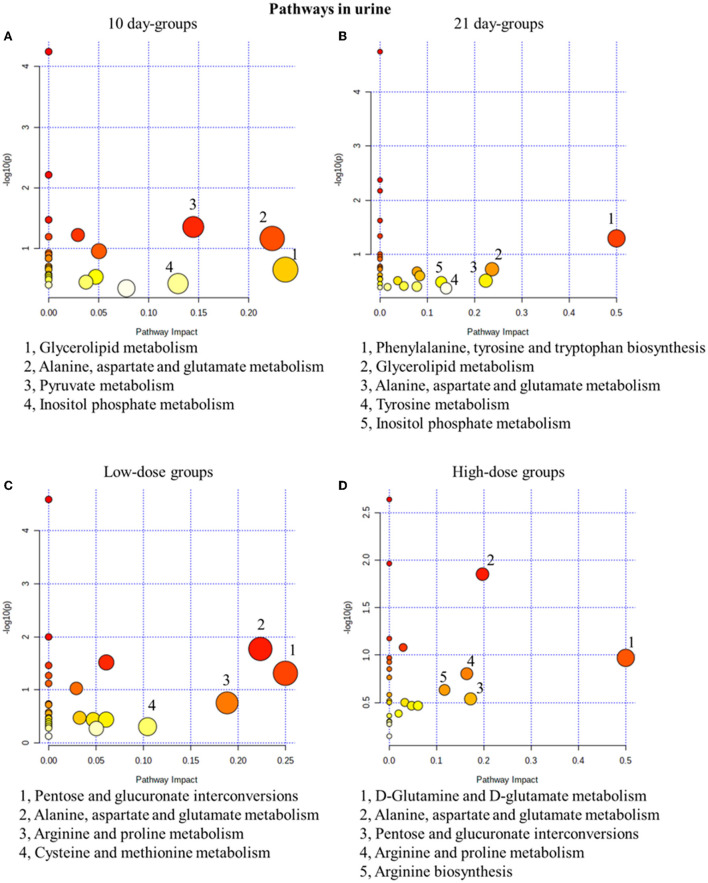
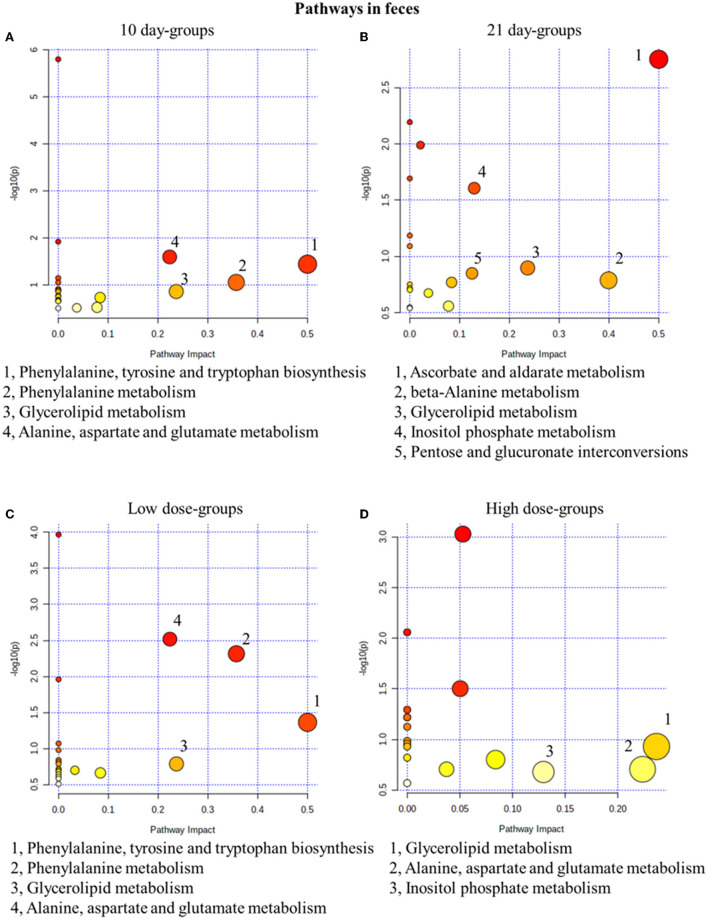
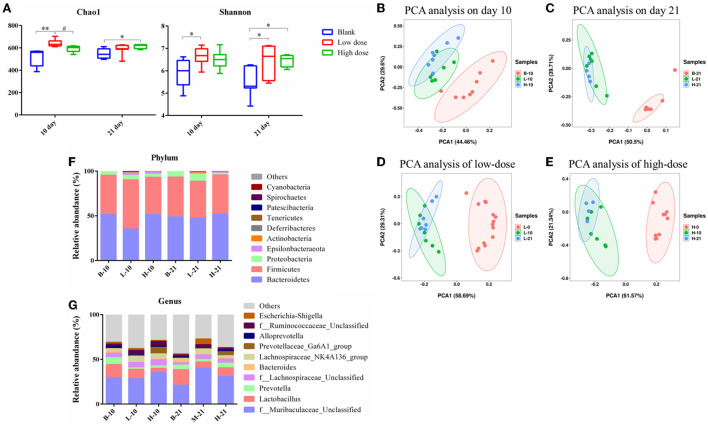
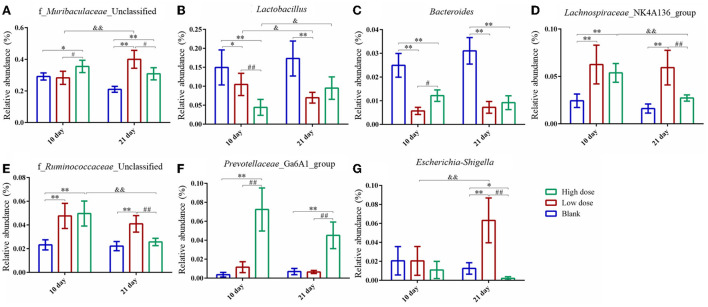
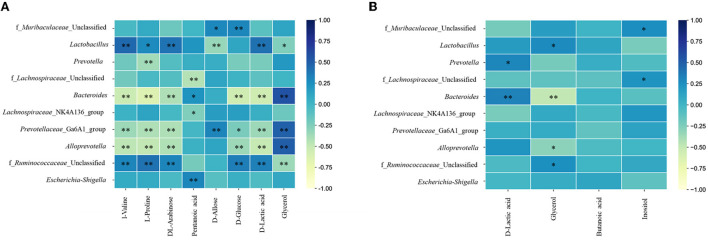
In recent years, many reports focus on the hepatotoxicity of Gynura segetum root extract (GSrE), but the interaction between GSrE and the gut microbiota is still unclear. This study investigated the mechanism of GSrE-induced hepatotoxicity of different doses and exposure durations by combining metabolomics and gut microbiota analysis. SD rats were divided into 3 groups: blank, low-dose (7.5 g/kg), and high-dose (15 g/kg) groups. Urine and feces samples were collected on day 0, day 10, and day 21. Metabolomics based on gas chromatography-mass spectrometry (GC-MS) was carried out to identify metabolites and metabolic pathways. 16S rDNA gene sequencing was applied to investigate the composition of gut microbiota before and after GSrE-induced hepatotoxicity. Finally, a correlation analysis of metabolites and gut microbiota was performed. Differential metabolites in urine and feces involved amino acids, carbohydrates, lipids, organic acids, and short chain fatty acids. Among them, L-valine, L-proline, DL-arabinose, pentanoic acid, D-allose, and D-glucose in urine and D-lactic acid and glycerol in fecal metabolites depended on the exposure of time and dose. In addition, 16S rDNA sequencing analysis revealed that GSrE-induced hepatotoxicity significantly altered the composition of gut microbiota, namely, f_Muribaculaceae_Unclassified, Lactobacillus, Bacteroides, Lachnospiraceae_NK4A136_group, f_Ruminococcaceae_Unclassified, Prevotellaceae_Ga6A1_group, and Escherichia-Shigella. The correlation analysis between gut microbiota and differential metabolites showed the crosstalk between the gut microbiota and metabolism in host involving energy, lipid, and amino acid metabolisms. In summary, our findings revealed that peripheral metabolism and gut microbiota disorders were time- and dose-related and the correlation between gut microbiota and metabolites in GSrE-induced hepatotoxicity.
Keywords: Gynura segetum (Lour.) Merr.; correlation analysis; gut microbiota; hepatotoxicity; metabolomics.
Copyright © 2022 Gu, Li, Lu, Li, Wang, Chen, Jia, Cao, Zhang, Zhou and Gou.
Conflict of interest statement
The authors declare that the research was conducted in the absence of any commercial or financial relationships that could be construed as a potential conflict of interest.
Figures
Similar articles
-
Fecal metabonomics combined with 16S rRNA gene sequencing to analyze the changes of gut microbiota in rats with kidney-yang deficiency syndrome and the intervention effect of You-gui pill.J Ethnopharmacol. 2019 Nov 15;244:112139. doi: 10.1016/j.jep.2019.112139. Epub 2019 Aug 8. J Ethnopharmacol. 2019. PMID: 31401318
-
Urine and plasma metabolomics study on potential hepatoxic biomarkers identification in rats induced by Gynura segetum.J Ethnopharmacol. 2018 Apr 24;216:37-46. doi: 10.1016/j.jep.2018.01.017. Epub 2018 Jan 17. J Ethnopharmacol. 2018. PMID: 29353003
-
Genus unclassified_Muribaculaceae and microbiota-derived butyrate and indole-3-propionic acid are involved in benzene-induced hematopoietic injury in mice.Chemosphere. 2023 Feb;313:137499. doi: 10.1016/j.chemosphere.2022.137499. Epub 2022 Dec 6. Chemosphere. 2023. PMID: 36493894
-
Mass spectrometry-based metabolomics: Targeting the crosstalk between gut microbiota and brain in neurodegenerative disorders.Mass Spectrom Rev. 2019 Jan;38(1):22-33. doi: 10.1002/mas.21553. Epub 2017 Nov 12. Mass Spectrom Rev. 2019. PMID: 29130504 Review.
-
Mass spectrometry-based analysis of gut microbial metabolites of aromatic amino acids.Comput Struct Biotechnol J. 2023 Sep 26;21:4777-4789. doi: 10.1016/j.csbj.2023.09.032. eCollection 2023. Comput Struct Biotechnol J. 2023. PMID: 37841334 Free PMC article. Review.
Cited by
-
Integrative analysis of the molecular signature of target genes involved in the antitumor effects of cantharidin on hepatocellular carcinoma.BMC Cancer. 2023 Nov 28;23(1):1161. doi: 10.1186/s12885-023-11594-8. BMC Cancer. 2023. PMID: 38017425 Free PMC article.
References
LinkOut - more resources
Full Text Sources
Miscellaneous