

Contribution of local climate zones to the thermal environment and energy demand
- PMID: 36016886
- PMCID: PMC9395604
- DOI: 10.3389/fpubh.2022.992050
Contribution of local climate zones to the thermal environment and energy demand
Abstract
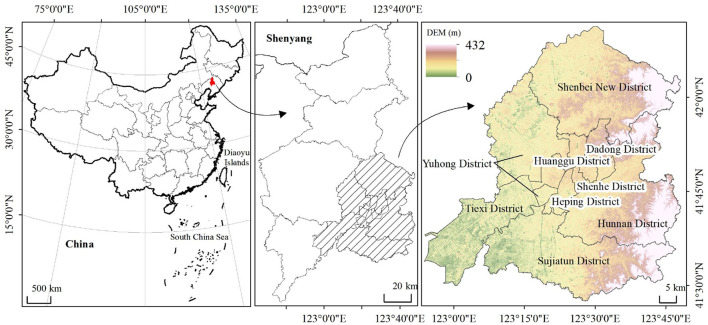
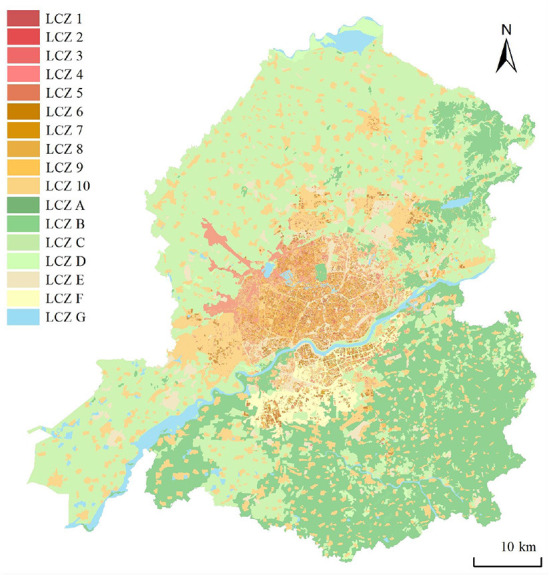
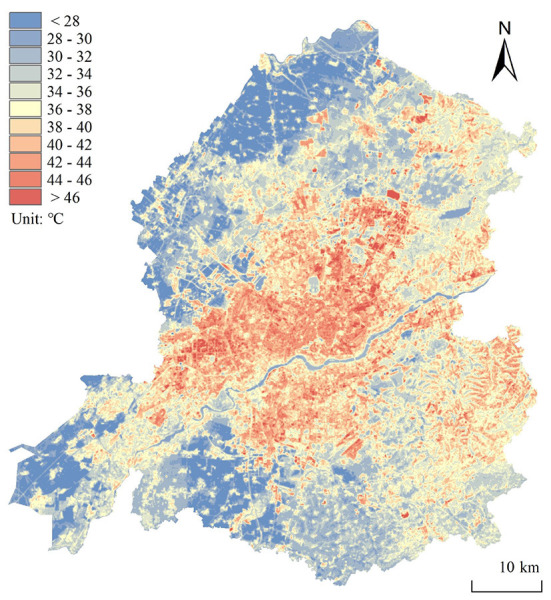
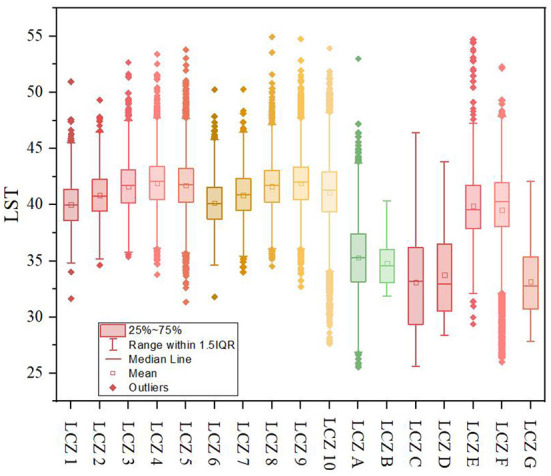
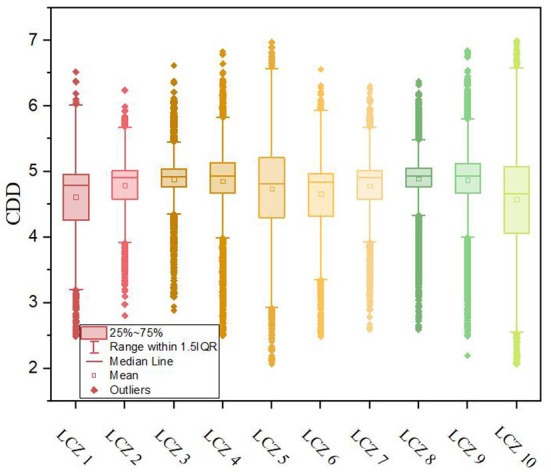
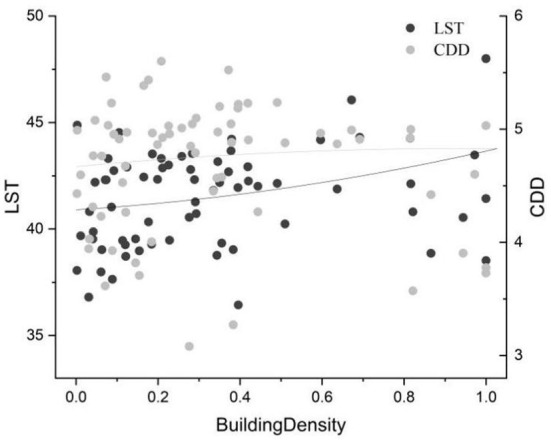
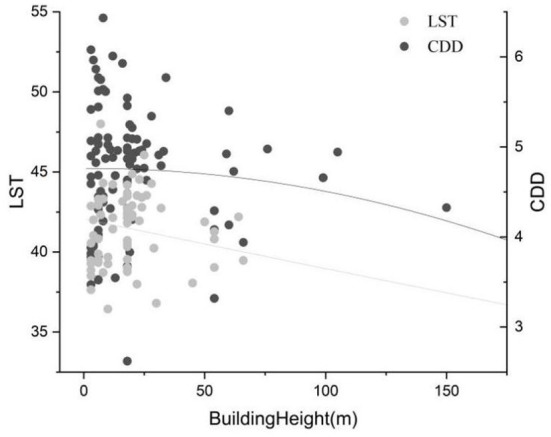
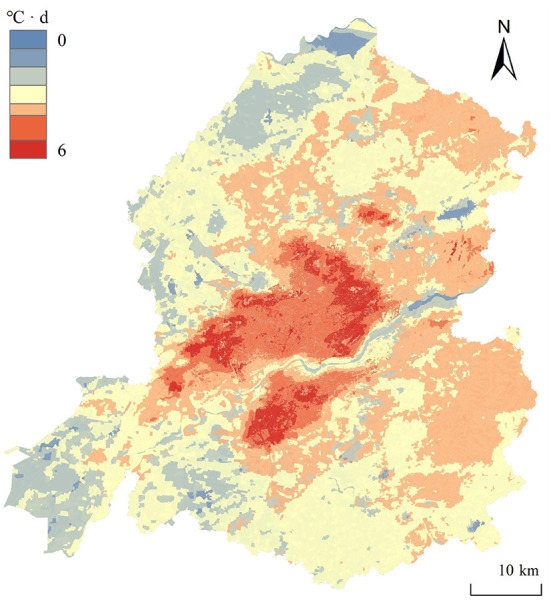
Urban heat islands (UHIs) and their energy consumption are topics of widespread concern. This study used remote sensing images and building and meteorological data as parameters, with reference to Oke's local climate zone (LCZ), to divide urban areas according to the height and density of buildings and land cover types. While analyzing the heat island intensity, the neural network training method was used to obtain temperature data with good temporal as well as spatial resolution. Combining degree-days with the division of LCZs, a more accurate distribution of energy demand can be obtained by different regions. Here, the spatial distribution of buildings in Shenyang, China, and the law of land surface temperature (LST) and energy consumption of different LCZ types, which are related to building height and density, were obtained. The LST and energy consumption were found to be correlated. The highest heat island intensity, i.e., UHILCZ 4, was 8.17°C. The correlation coefficients of LST with building height and density were -0.16 and 0.24, respectively. The correlation between urban cooling energy demand and building height was -0.17, and the correlation between urban cooling energy demand and building density was 0.17. The results indicate that low- and medium-rise buildings consume more cooling energy.
Keywords: air temperature inversion; degree-days; energy consumption; neural network; urban heat island.
Copyright © 2022 Yang, Yang, Wang, Xiao and Xia.
Conflict of interest statement
The authors declare that the research was conducted in the absence of any commercial or financial relationships that could be construed as a potential conflict of interest.
Figures
Similar articles
-
Variations of Urban Thermal Risk with Local Climate Zones.Int J Environ Res Public Health. 2023 Feb 13;20(4):3283. doi: 10.3390/ijerph20043283. Int J Environ Res Public Health. 2023. PMID: 36833977 Free PMC article.
-
Multi-Temporal Effects of Urban Forms and Functions on Urban Heat Islands Based on Local Climate Zone Classification.Int J Environ Res Public Health. 2019 Jun 17;16(12):2140. doi: 10.3390/ijerph16122140. Int J Environ Res Public Health. 2019. PMID: 31212953 Free PMC article.
-
Urban Design Factors Influencing Surface Urban Heat Island in the High-Density City of Guangzhou Based on the Local Climate Zone.Sensors (Basel). 2019 Aug 8;19(16):3459. doi: 10.3390/s19163459. Sensors (Basel). 2019. PMID: 31398810 Free PMC article.
-
A Review of Studies Involving the Effects of Climate Change on the Energy Consumption for Building Heating and Cooling.Int J Environ Res Public Health. 2020 Dec 23;18(1):40. doi: 10.3390/ijerph18010040. Int J Environ Res Public Health. 2020. PMID: 33374644 Free PMC article. Review.
-
Identifying research progress, focuses, and prospects of local climate zone (LCZ) using bibliometrics and critical reviews.Heliyon. 2023 Feb 25;9(3):e14067. doi: 10.1016/j.heliyon.2023.e14067. eCollection 2023 Mar. Heliyon. 2023. PMID: 36915474 Free PMC article. Review.
Cited by
-
Influenza incidence and air pollution: Findings from a four-year surveillance study of prefecture-level cities in China.Front Public Health. 2022 Dec 2;10:1071229. doi: 10.3389/fpubh.2022.1071229. eCollection 2022. Front Public Health. 2022. PMID: 36530677 Free PMC article.
-
General Analysis of Heat Shock Factors in the Cymbidium ensifolium Genome Provided Insights into Their Evolution and Special Roles with Response to Temperature.Int J Mol Sci. 2024 Jan 13;25(2):1002. doi: 10.3390/ijms25021002. Int J Mol Sci. 2024. PMID: 38256078 Free PMC article.
-
Variations of Urban Thermal Risk with Local Climate Zones.Int J Environ Res Public Health. 2023 Feb 13;20(4):3283. doi: 10.3390/ijerph20043283. Int J Environ Res Public Health. 2023. PMID: 36833977 Free PMC article.
References
-
- He B. Potentials of meteorological characteristics and synoptic conditions to mitigate urban heat Island effects. Urban Climate. (2018) 18:2426–33. 10.1016/j.uclim.2018.01.004 - DOI
-
- De Coninck H, Revi A, Babiker M, Bertoldi P, Buckeridge M, Cartwright A, et al. . “Strengthening and implementing the global response,” in Global Warming Of 1.5°C: Summary for Policy Makers, IPCC - The Intergovernmental Panel On Climate Change. (2018), p. 313–443.
-
- Wei Y, Zhang X, Shi Y, Xia L, Pan S, Wu J, et al. . A review of data-driven approaches for prediction and classification of building energy consumption. Renew. Sustain. Energy Rev. (2018) 18:821027–1047. 10.1016/j.rser.2017.09.108 - DOI
Publication types
MeSH terms
LinkOut - more resources
Full Text Sources