. 2022 Aug 9:13:953660.
doi: 10.3389/fimmu.2022.953660. eCollection 2022.

Spatial organization and early signaling of the B-cell receptor in CLL

Affiliations

Spatial organization and early signaling of the B-cell receptor in CLL

Yamit Shorer Arbel et al. Front Immunol. .

Abstract

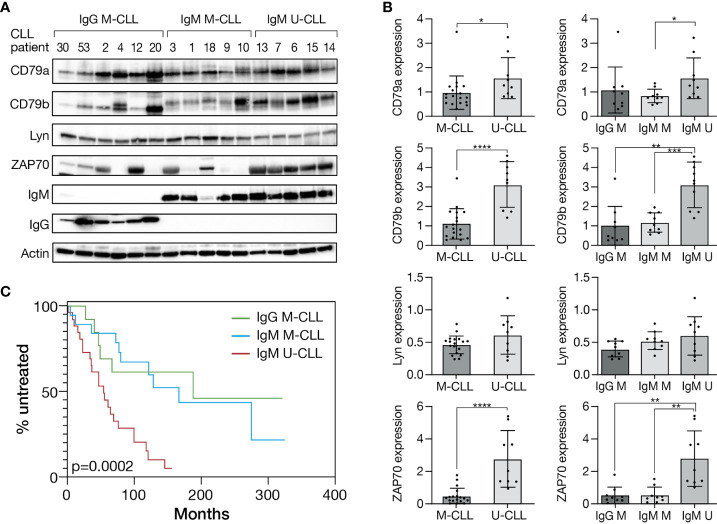
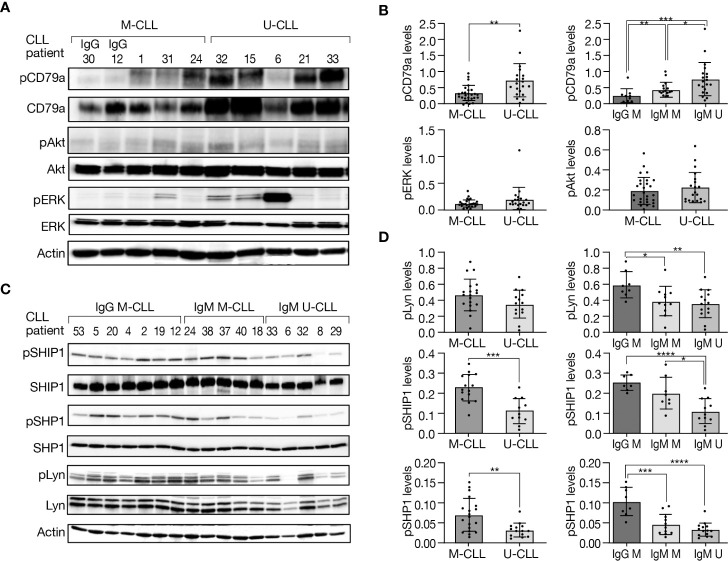
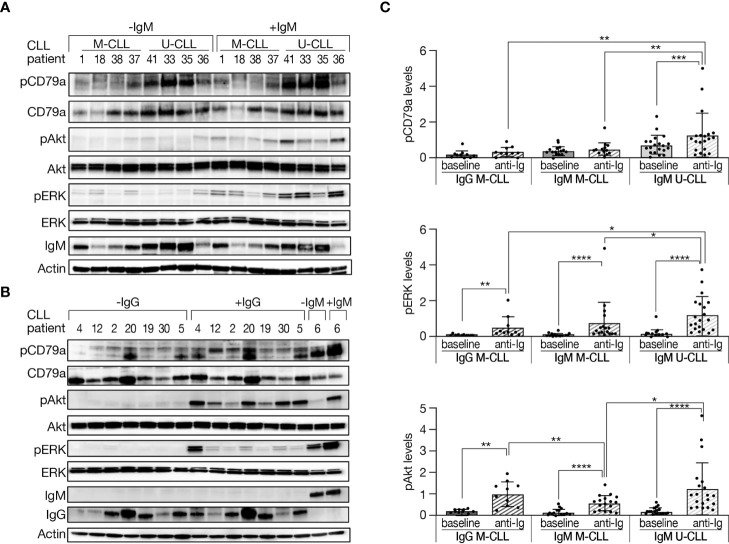
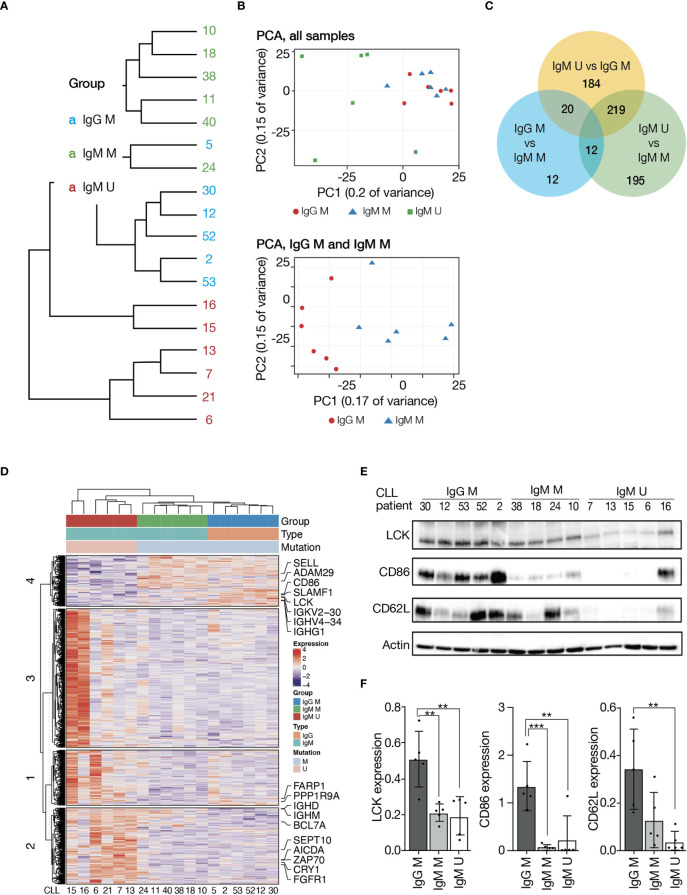
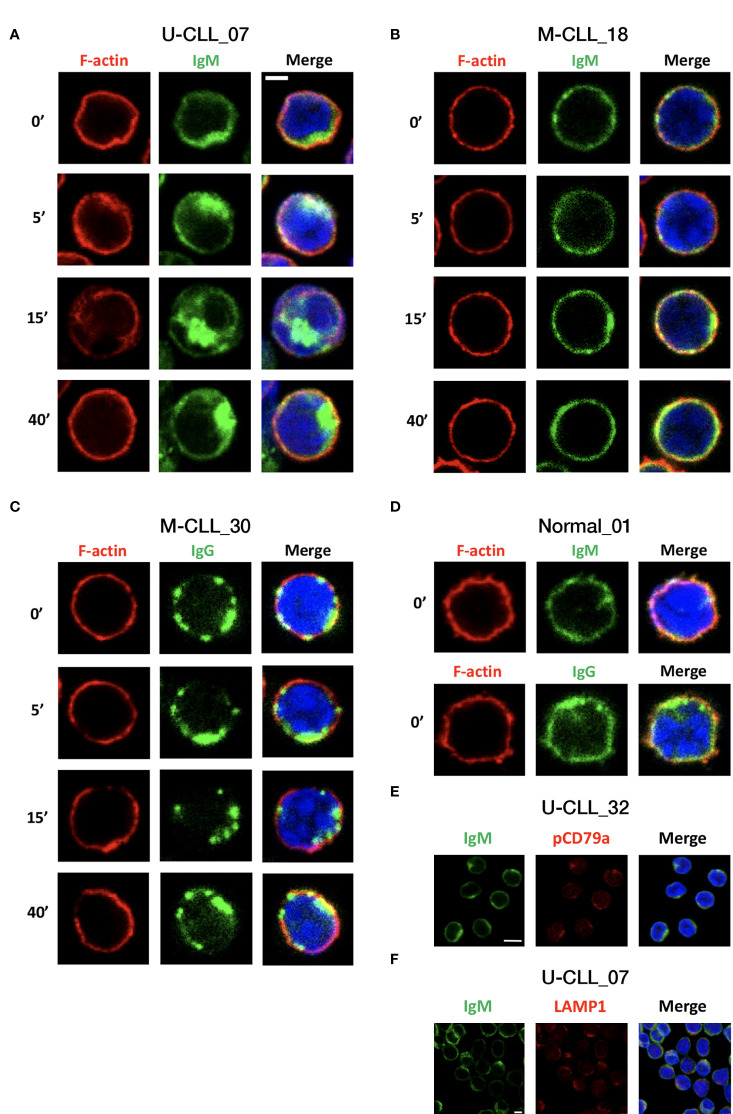
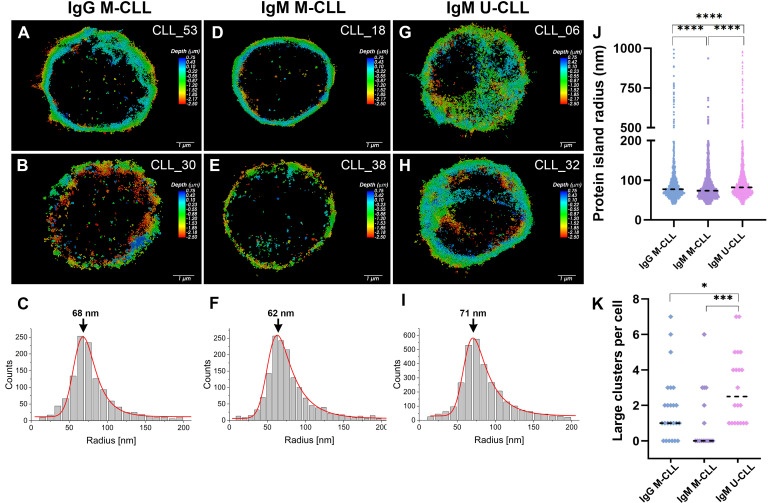
Most chronic lymphocytic leukemia (CLL) clones express B-cell receptors (BcR) of both IgM/IgD isotypes; however, 5%-10% of CLL cases express isotype-switched immunoglobulin G (IgG). The early signaling and spatial patterning of the various BcRs at steady state and after activation are still fully unresolved. Herein, we show higher expression of the BcR signalosome elements and a more robust constitutive cell-intrinsic proximal BcR signaling in CLL with unmutated IGHV expressing IgM isotype (IgM U-CLL), compared with IGHV-mutated CLL (M-CLL) expressing either IgM or IgG isotypes. IgM in U-CLL is frequently located in the membrane plane in polarized patches, occasionally in caps, and sometimes inside the cells. Among M-CLL, IgM is scattered laterally in the membrane plane in a similar pattern as seen in normal B cells, whereas IgG is dispersed around the cell membrane in smaller clusters than in IgM U-CLL. Upon BcR engagement, both IgG and IgM expressing M-CLL showed attenuated signaling and only slight spatial reorganization dynamics of BcR microclusters and internalization, compared with the extensive reorganization and internalization of the BcR in IgM expressing U-CLL. The global gene signature of IgG M-CLL was closely related to that of IgM M-CLL rather than IgM U-CLL. Overall, we report fundamental differences in the basal composition, biochemical status, and spatial organization of the BcR in the three examined immunogenetic CLL subtypes that correlate with their clinical behavior. On the basis of our findings, IgG class-switched M-CLL likely represents the same disease as IgM M-CLL rather than a different biological and/or clinical entity.

Keywords: BCR signaling; CLL (chronic lymphocytic leukemia); IGHV mutational status; IgG; IgM; d-STORM.


Conflict of interest statement

YH received honoraria from AstraZeneca, Janssen, AbbeVie, and Medison for work unrelated to the present study. The remaining authors declare that the research was conducted in the absence of any commercial or financial relationships that could be construed as a potential conflict of interest.

Figures

Figure 1
Figure 1
Different expression pattern of proximal BcR signaling proteins in CLL immunogenetic subtypes. (A) A representative Western blot analysis of primary CD19+ purified cells from M-CLL and U-CLL cases showing CD79a, CD79b, Lyn, ZAP70, IgM, and IgG levels. Actin was used to verify equal loading. (B) Quantification of CD79a, CD79b, Lyn, and ZAP70 levels in IgG M-CLL, IgM M-CLL, and IgM U-CLL cells in (A) by normalization to actin using myImageAnalysis™ Software (n = 27). *p < 0.05, **p < 0.01, ***p < 0.001, and ****p < 0.0001. (C) Kaplan–Meier analysis of time to first treatment according to IGHV gene SHM status and IG subclass(n = 58).
Figure 2
Figure 2
Basal phosphorylation levels of BcR signaling elements in M-CLL and U-CLL cells. (A) Representative Western blot analysis showing CD79a (Y182), Akt (S473), and ERK (T202/Y204) phosphorylation as well as total amount of these proteins. Actin was used to verify equal loading. (B) Quantification of pCD79a, pAkt, and pERK levels in (A) by normalization to actin using the myImageAnalysis™ Software (n = 47). *p < 0.05, **p < 0.01, and ***p < 0.001. (C) A Western blot analysis showing SHIP1 (Y1020), SHP1 (Y564), and Lyn (Y396) phosphorylation, as well as total amount of these proteins. Actin was used to verify equal loading. (D) Quantification of pSHIP1 (n = 26), pSHP1 and pLyn (n = 33) in (C) by normalization to actin using the myImageAnalysis™ Software. *p < 0.05, **p < 0.01, ***p < 0.001, and ****p < 0.0001.
Figure 3
Figure 3
Phosphorylation levels of BcR signaling elements in M-CLL and U-CLL cells after BcR activation. (A, B) Peripheral blood CLL cells were incubated with goat F(ab′)2 anti-human IgM or with goat F(ab′)2 anti-human IgG (10 µg/ml) for 15 min or left untreated. Protein was extracted and analyzed by Western blot. A representative Western blot analysis showing CD79a (Y182), Akt (S473), and ERK (T202/Y204) phosphorylation, as well as total amount of these proteins, and IgM and IgG levels. Actin was used to verify equal loading. (C) Quantification of pCD79a, pAkt, and pERK levels in activated and inactivated CLL cells in (A, B) by normalization to actin using the myImageAnalysis™ Software. (n = 47).*p < 0.05, **p < 0.01, ***p < 0.001, and ****p < 0.0001.
Figure 4
Figure 4
Gene expression profiling of CLL immunogenetic subgroups. RNA was extracted from unstimulated CD19+ CLL cells. Sequencing libraries were prepared using INCPM mRNA. (A) Unsupervised hierarchical clustering. (B) Principal component analysis. (C) Venn diagram showing the number of genes differentially expressed between the three subgroups. (D) Heatmap of genes differentially expressed between the three subgroups (>2-fold change, padj ≤ 0.05). Gene expression is median centered and scaled as indicated. (E) Representative Western blot analysis of IgM or IgG M-CLL and IgM U-CLL cells showing LCK, CD86, and CD62L levels. Actin was used to verify equal loading. (F) Quantification of LCK, CD86, and CD62L levels in IgG M-CLL, IgM M-CLL, and IgM U-CLL cells in (E) by normalization to actin using the myImageAnalysis™Software (n = 15). **p < 0.01 and ***p < 0.001.
Figure 5
Figure 5
IgM, IgG, and F-actin distribution and localization before and after activation. CLL cells were seeded on poly-L-lysine–coated glass and then left either inactivated or activated with F(ab′)2 Fragment anti-IgM or F(ab′)2 Fragment anti-IgG for 5, 15, and 40 min. The cells were fixed and permeabilized, followed by staining. The images presented are confocal slices through the center of the cell. (A) Representative IgM U-CLL case. (B) Representative IgM M-CLL case. (C) Representative IgG M-CLL case. (D) Representative case of IgM and IgG staining in normal B cells. Scale bar, 2 μm. (E) Unstimulated CLL cells were stained for IgM and pCD79a. Representative images of patient with U-CLL are shown. Scale bar, 5 μm (n = 3). (F) Unstimulated CLL cells were stained for IgM and LAMP1. Representative images of patient with U-CLL are shown. Scale bar, 2.5 μm (n = 4).
Figure 6
Figure 6
IgM and IgG imaging and cluster analysis using d-STORM. Typical three-dimensional d-STORM images of (A, B) patients with IgG M-CLL, (D, E) patients with IgM M-CLL, and (G–H) patients with IgM U-CLL. Images are x-y projections of individual BcR localizations, in which the depth (distance along the z axis) is shown in color coded manner. (C, F, I) Statistical distribution of BcR small cluster size (range of 40–200 in radius) in IgG M-CLL, IgM M-CLL, and IgM U-CLL groups, respectively. The peak value of the Gaussian fit (in red) is marked with an error. (J) Radius distribution of protein islands at the cell membrane for IgG M-CLL, IgM M-CLL, and IgM U-CLL; median is marked in a black dashed line. ****p < 0.0001. (K) Number of large clusters (500–1,000 nm) per cell for IgG M-CLL, IgM M-CLL, and IgM U-CLL; mean value with one standard deviation is marked in black. *p < 0.05 and ***p < 0.001.

References

    1. Caligaris-Cappio F, Hamblin TJ. B-cell chronic lymphocytic leukemia: A bird of a different feather. J Clin Oncol (1999) 17(1):399–408. doi: 10.1200/JCO.1999.17.1.399 - DOI - PubMed
    1. Ghia P, Chiorazzi N, Stamatopoulos K. Microenvironmental influences in chronic lymphocytic leukaemia: The role of antigen stimulation. J Intern Med (2008) 264(6):549–62. doi: 10.1111/j.1365-2796.2008.02030.x - DOI - PubMed
    1. Stevenson FK, Krysov S, Davies AJ, Steele AJ, Packham G. B-cell receptor signaling in chronic lymphocytic leukemia. Blood (2011) 118(16):4313–20. doi: 10.1182/blood-2011-06-338855 - DOI - PubMed
    1. Wiestner A. Emerging role of kinase-targeted strategies in chronic lymphocytic leukemia. Hematol Am Soc Hematol Educ Program (2012) 2012:88–96. doi: 10.1182/asheducation.V2012.1.88.3801172 - DOI - PubMed
    1. Herishanu Y, Pérez-Galán P, Liu D, Biancotto A, Pittaluga S, Vire B, et al. . The lymph node microenvironment promotes b-cell receptor signaling, NF-κB activation, and tumor proliferation in chronic lymphocytic leukemia. Blood (2011) 117(2):563–74. doi: 10.1182/blood-2010-05-284984 - DOI - PMC - PubMed

Publication types

MeSH terms