

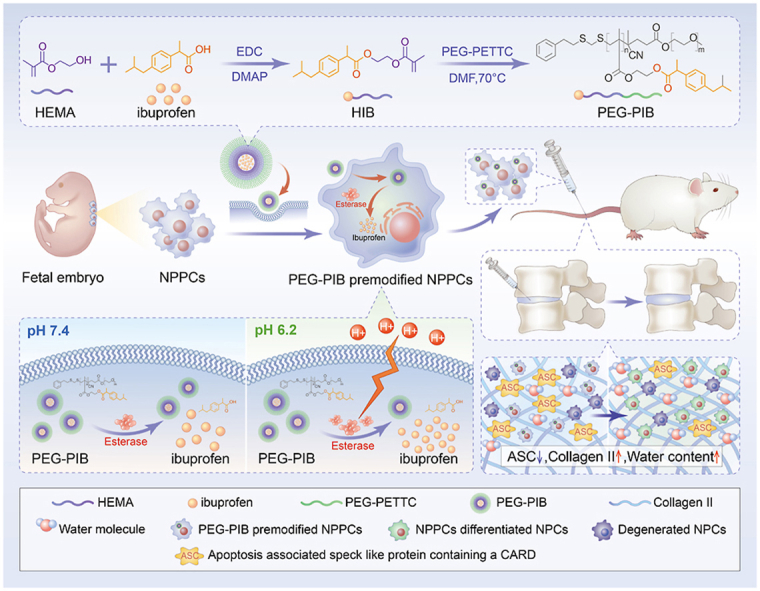
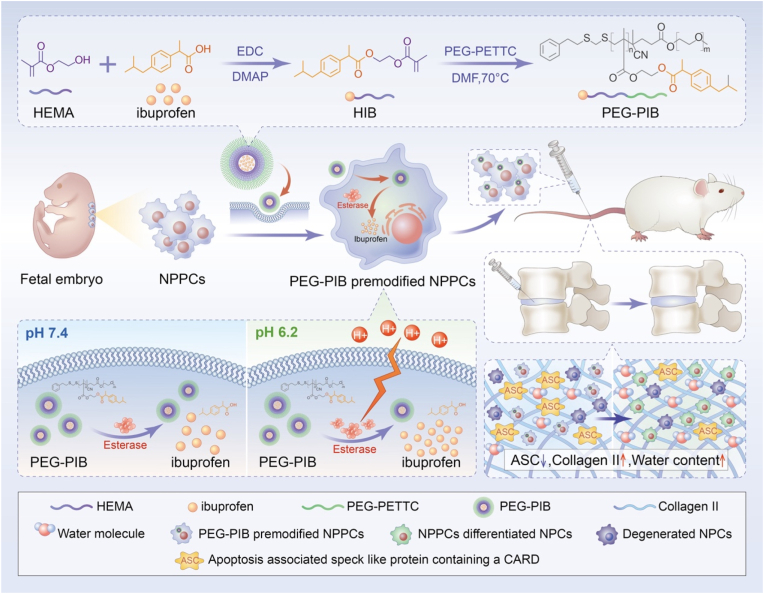
An esterase-responsive ibuprofen nano-micelle pre-modified embryo derived nucleus pulposus progenitor cells promote the regeneration of intervertebral disc degeneration
- PMID: 36017070
- PMCID: PMC9399388
- DOI: 10.1016/j.bioactmat.2022.07.024
An esterase-responsive ibuprofen nano-micelle pre-modified embryo derived nucleus pulposus progenitor cells promote the regeneration of intervertebral disc degeneration
Abstract
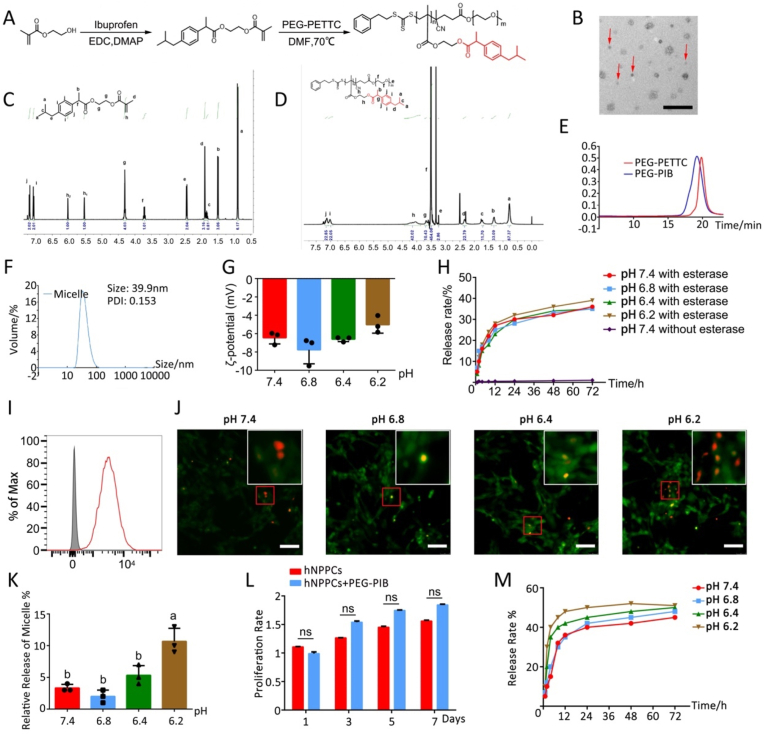
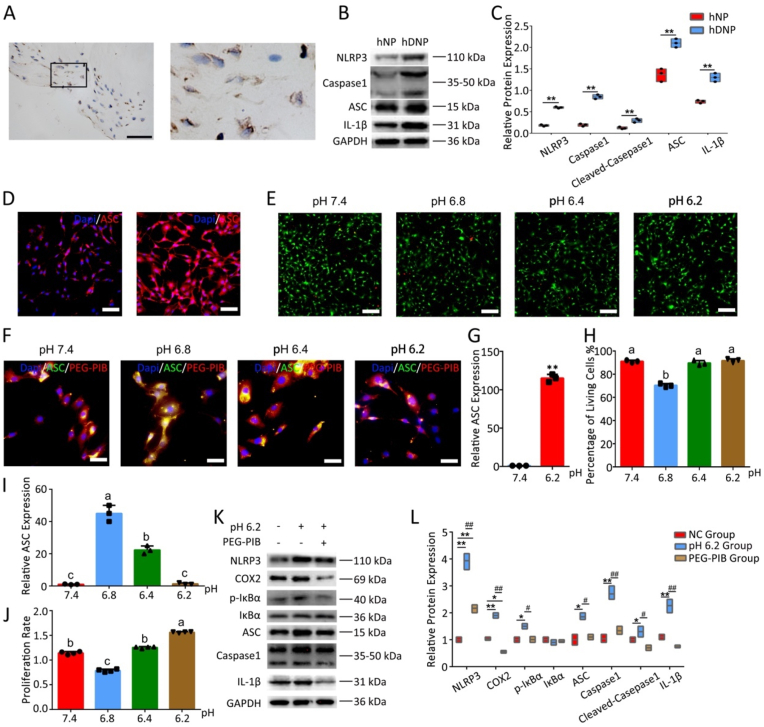
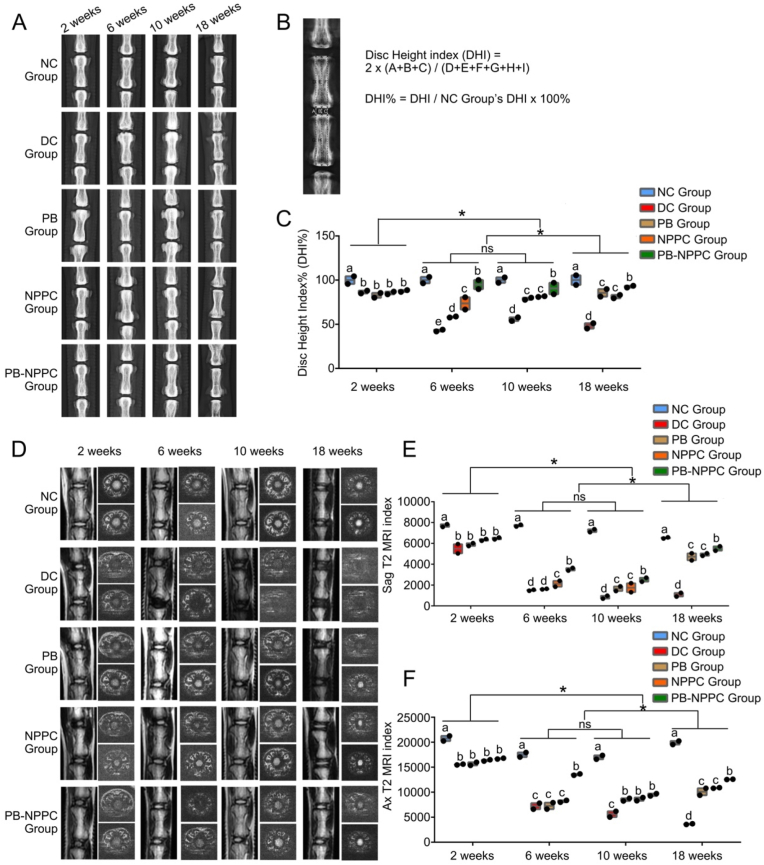
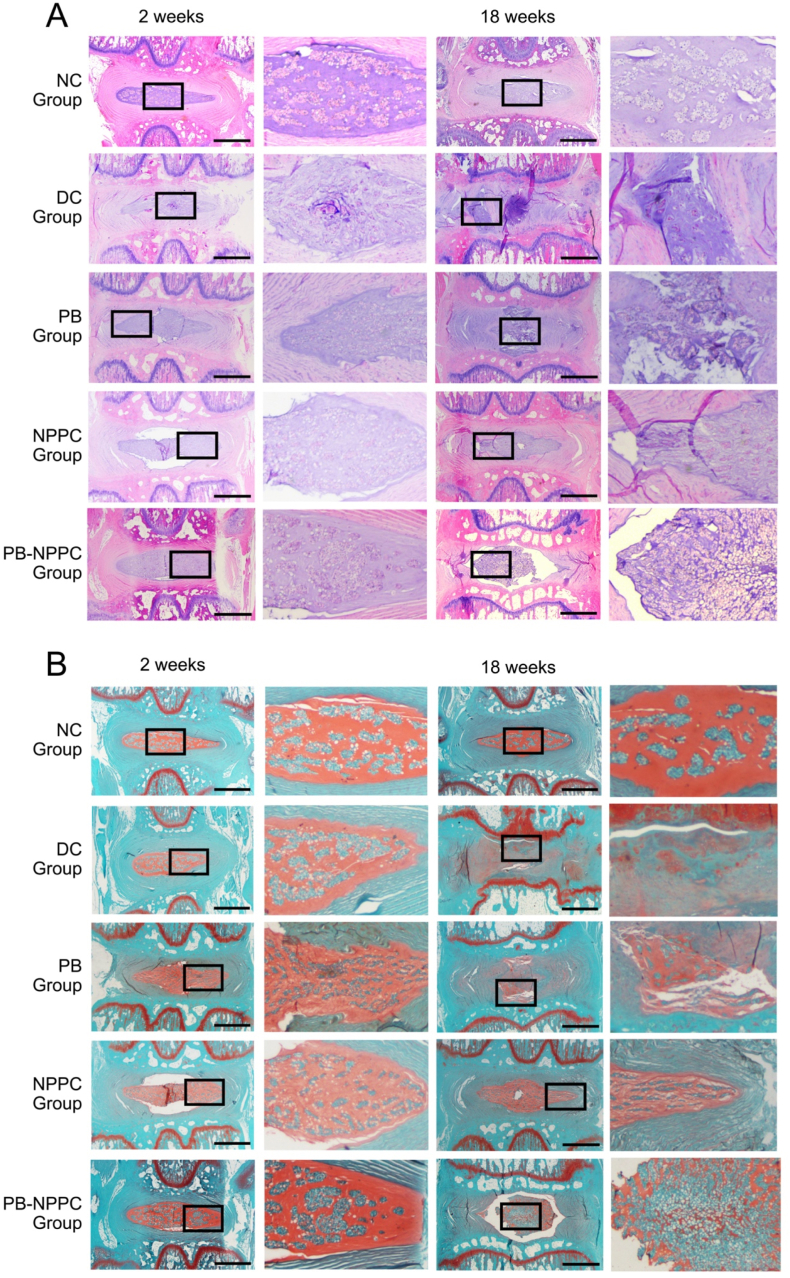
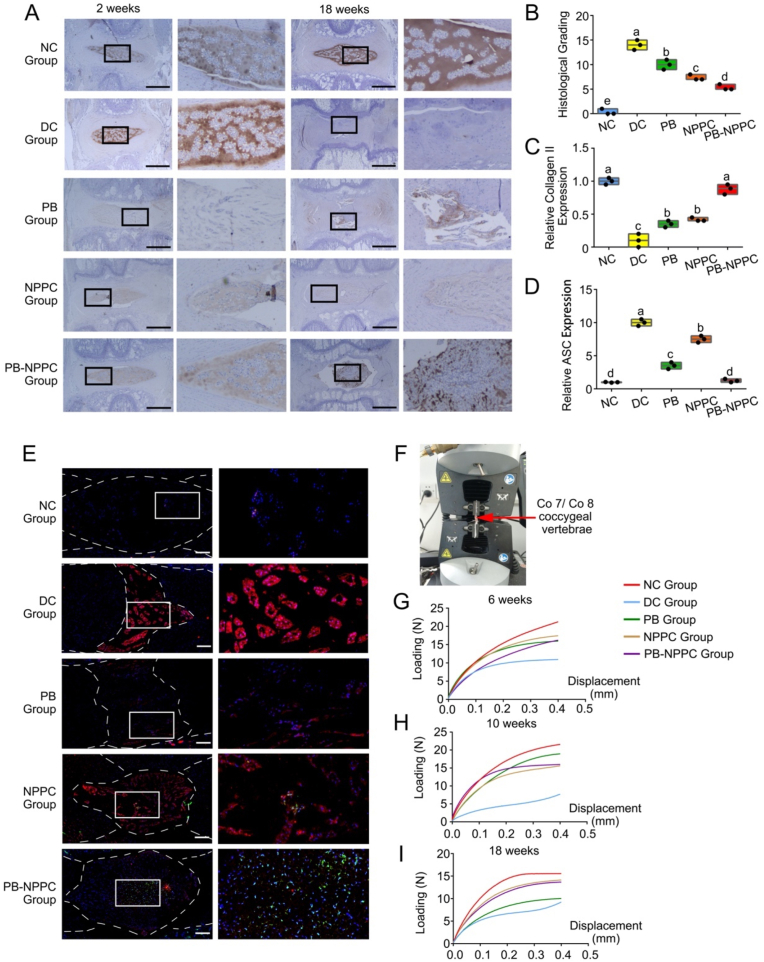
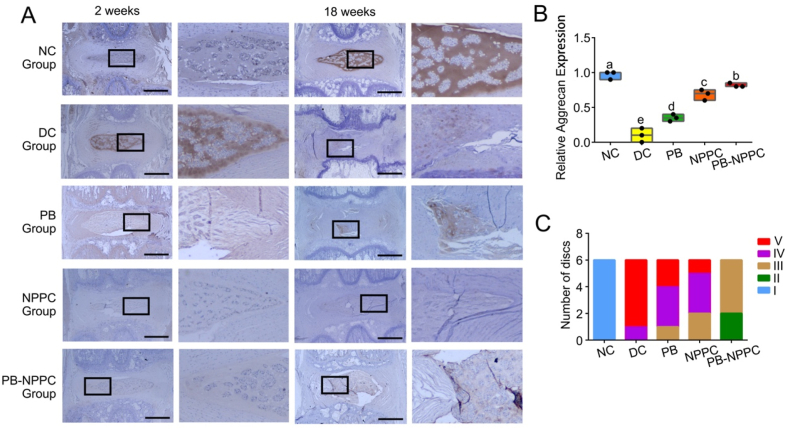
Stem cell-based transplantation is a promising therapeutic approach for intervertebral disc degeneration (IDD). Current limitations of stem cells include with their insufficient cell source, poor proliferation capacity, low nucleus pulposus (NP)-specific differentiation potential, and inability to avoid pyroptosis caused by the acidic IDD microenvironment after transplantation. To address these challenges, embryo-derived long-term expandable nucleus pulposus progenitor cells (NPPCs) and esterase-responsive ibuprofen nano-micelles (PEG-PIB) were prepared for synergistic transplantation. In this study, we propose a biomaterial pre-modification cell strategy; the PEG-PIB were endocytosed to pre-modify the NPPCs with adaptability in harsh IDD microenvironment through inhibiting pyroptosis. The results indicated that the PEG-PIB pre-modified NPPCs exhibited inhibition of pyroptosis in vitro; their further synergistic transplantation yielded effective functional recovery, histological regeneration, and inhibition of pyroptosis during IDD regeneration. Herein, we offer a novel biomaterial pre-modification cell strategy for synergistic transplantation with promising therapeutic effects in IDD regeneration.
Keywords: Biomaterial pre-modification; Esterase-responsive nano micell; Intervertebral disc degeneration; Nucleus pulposus progenitor cells; Synergistic transplantation therapy.
© 2022 The Authors.
Figures
References
-
- Zhou M., Wang H., Zeng X., Yin P., Zhu J., Chen W., Li X., Wang L., Wang L., Liu Y., Liu J., Zhang M., Qi J., Yu S., Afshin A., Gakidou E., Glenn S., Krish V.S., Miller-Petrie M.K., Mountjoy-Venning W.C., Mullany E.C., Redford S.B., Liu H., Naghavi M., Hay S.I., Wang L., Murray C.J.L., Liang X. Mortality, morbidity, and risk factors in China and its provinces, 1990-2017: a systematic analysis for the Global Burden of Disease Study 2017. Lancet. 2019;394(10204):1145–1158. - PMC - PubMed
-
- Dieleman J.L., Cao J., Chapin A., Chen C., Li Z., Liu A., Horst C., Kaldjian A., Matyasz T., Scott K.W., Bui A.L., Campbell M., Duber H.C., Dunn A.C., Flaxman A.D., Fitzmaurice C., Naghavi M., Sadat N., Shieh P., Squires E., Yeung K., Murray C.J.L. US health Care spending by payer and health condition. JAMA. 2020;323(9):863–884. 1996-2016. - PMC - PubMed
-
- Gruber H.E., Ingram J.A., Norton H.J., Hanley E.N., Jr. Senescence in cells of the aging and degenerating intervertebral disc: immunolocalization of senescence-associated beta-galactosidase in human and sand rat discs. Spine (Phila Pa 1976. 2007;32(3):321–327. - PubMed
LinkOut - more resources
Full Text Sources
Miscellaneous
