

Collaboration between meteorology and public health: Predicting the dengue epidemic in Guangzhou, China, by meteorological parameters
- PMID: 36017372
- PMCID: PMC9397942
- DOI: 10.3389/fcimb.2022.881745
Collaboration between meteorology and public health: Predicting the dengue epidemic in Guangzhou, China, by meteorological parameters
Abstract
Background: Dengue has become an increasing public health threat around the world, and climate conditions have been identified as important factors affecting the transmission of dengue, so this study was aimed to establish a prediction model of dengue epidemic by meteorological methods.
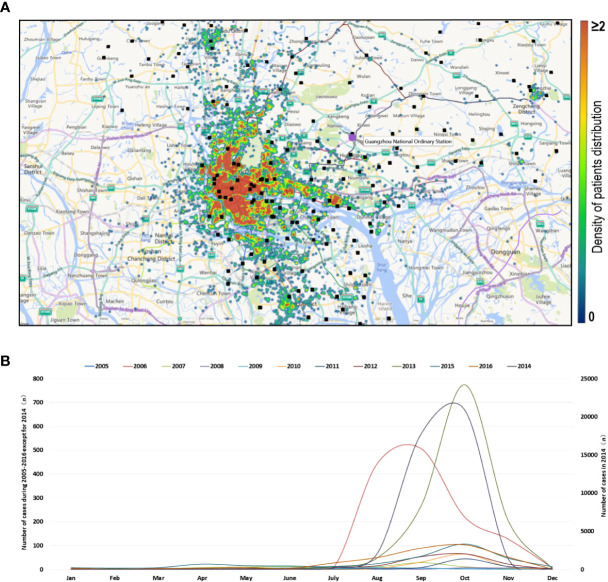
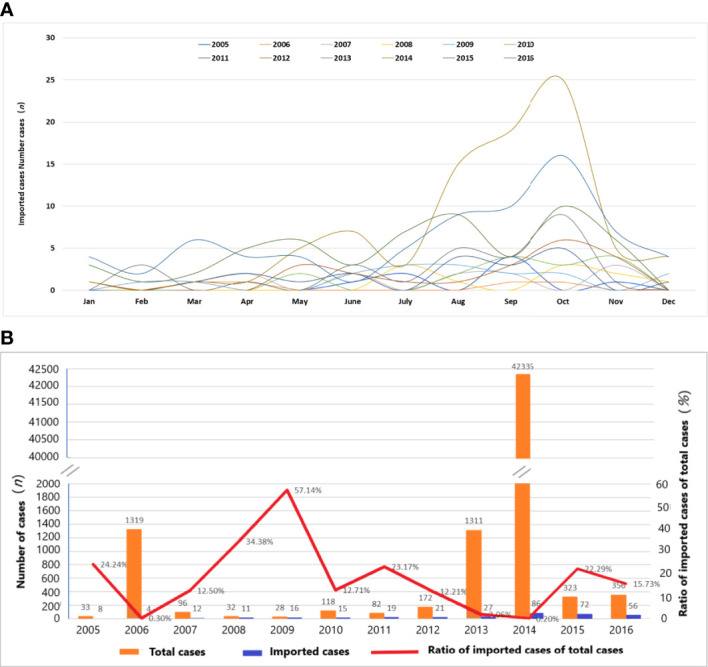
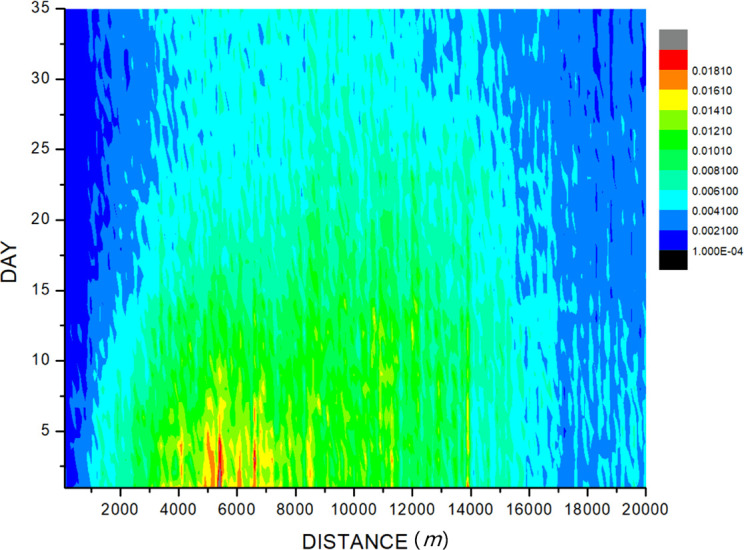
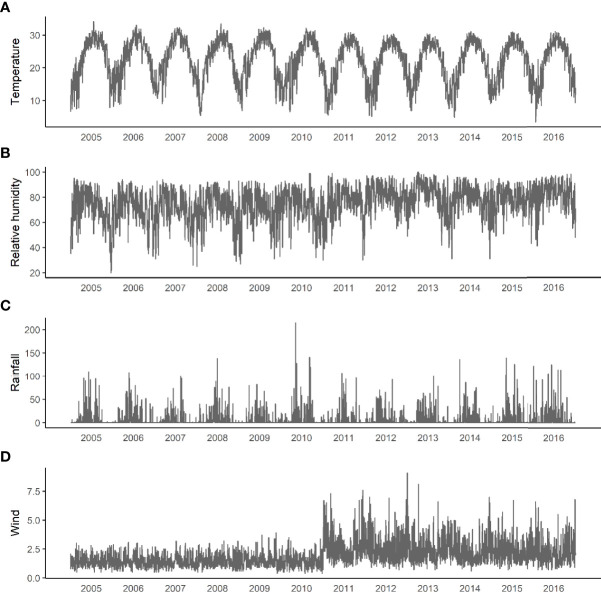
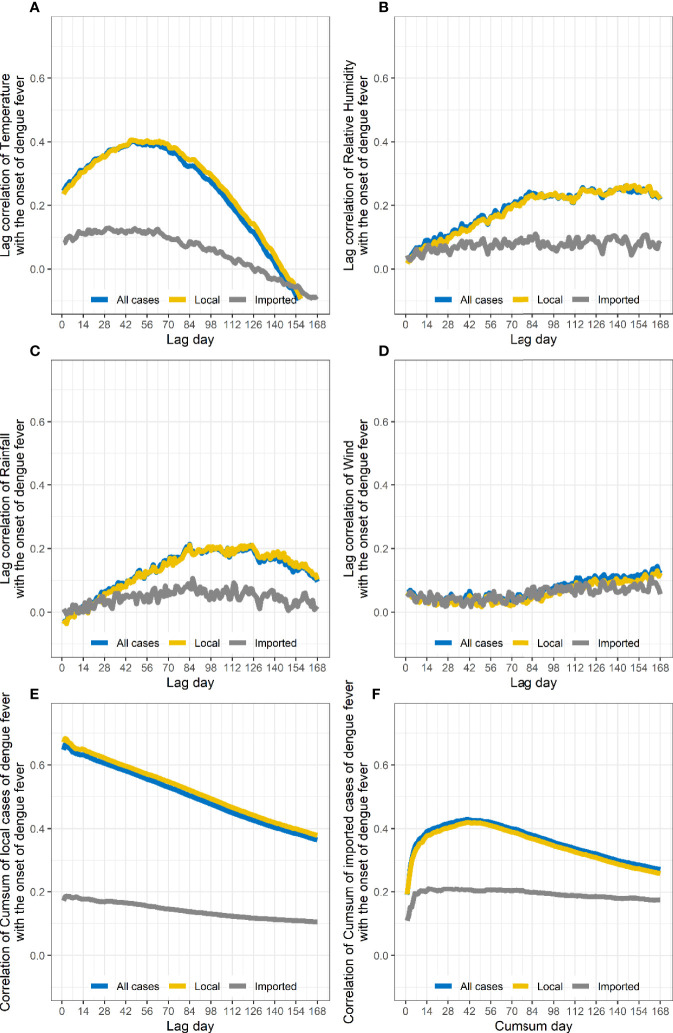
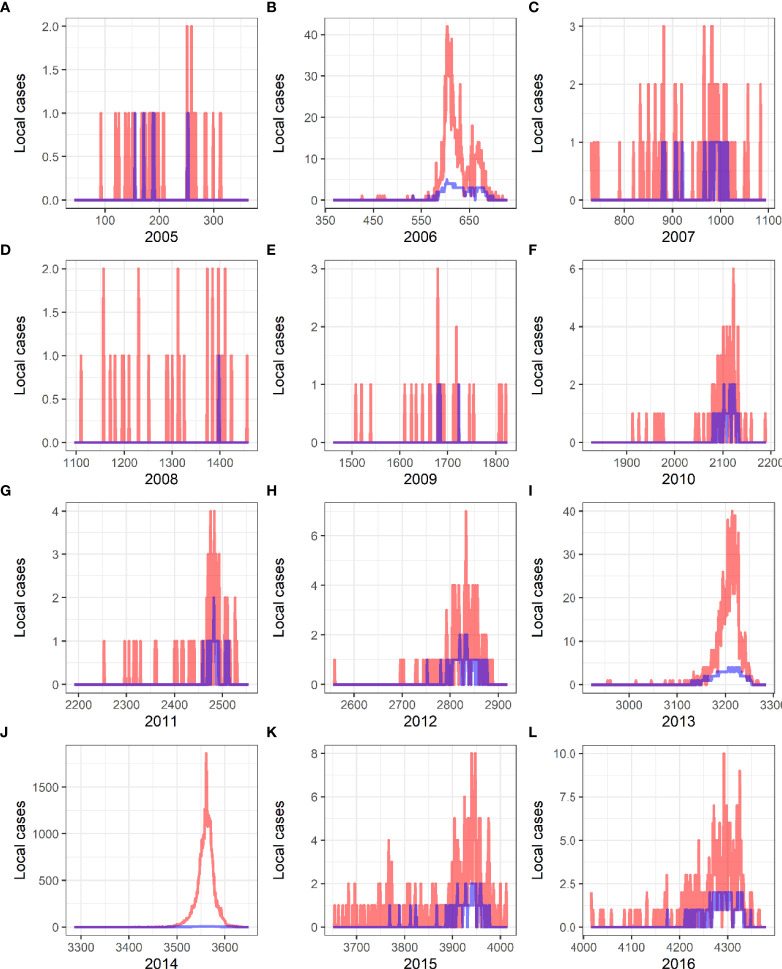
Methods: The dengue case information and meteorological data were collected from Guangdong Provincial Center for Disease Prevention and Control and Guangdong Meteorological Bureau, respectively. We used spatio-temporal analysis to characterize dengue epidemics. Spearman correlation analysis was used to analyze the correlation between lagged meteorological factors and dengue fever cases and determine the maximum lagged correlation coefficient of different meteorological factors. Then, Generalized Additive Models were used to analyze the non-linear influence of lagged meteorological factors on local dengue cases and to predict the number of local dengue cases under different weather conditions.
Results: We described the temporal and spatial distribution characteristics of dengue fever cases and found that sporadic single or a small number of imported cases had a very slight influence on the dengue epidemic around. We further created a forecast model based on the comprehensive consideration of influence of lagged 42-day meteorological factors on local dengue cases, and the results showed that the forecast model has a forecast effect of 98.8%, which was verified by the actual incidence of dengue from 2005 to 2016 in Guangzhou.
Conclusion: A forecast model for dengue epidemic was established with good forecast effects and may have a potential application in global dengue endemic areas after modification according to local meteorological conditions. High attention should be paid on sites with concentrated patients for the control of a dengue epidemic.
Keywords: Spearman correlation analysis; dengue fever; generalized additive models; meteorological parameter; spatial distribution; temporal characteristics.
Copyright © 2022 Chen, Ding, Liu, Xiao, Hu, Xiao, Yue, Lu, Han, Bu, Dong and Lin.
Conflict of interest statement
Author YL was employed by the company Guangzhou South China Biomedical Research Institute co., Ltd. and Shenzhen Withsum Technology Limited. The remaining authors declare that the research was conducted in the absence of any commercial or financial relationships that could be constructed as a potential conflict of interest.
Figures
References
-
- Almeida A. P., Baptista S. S., Sousa C. A., Novo M. T., Ramos H. C., Panella N. A., et al. (2005). Bioecology and vectorial capacity of aedes albopictus (Diptera: Culicidae) in Macao, China, in relation to dengue virus transmission. J. Med. Entomol. 42 (3), 419–428. doi: 10.1093/jmedent/42.3.419 - DOI - PubMed
-
- Ateba F. F., Febrero-Bande M., Sagara I., Sogoba N., Touré M., Sanogo D., et al. (2020). Predicting malaria transmission dynamics in dangassa, Mali: A novel approach using functional generalized additive models. Int. J. Environ. Res. Public Health 17 (17), 6339. doi: 10.3390/ijerph17176339 - DOI - PMC - PubMed
-
- Belcher B. N., Degaetano A. T. (2007). Spatial interpolation of daily maximum and minimum air temperature based on meteorological model analyses and independent observations. J. Appl. Meteorol. Climatol. 46 (11), 1981–1992. doi: 10.1175/2007JAMC1536.1 - DOI
Publication types
MeSH terms
LinkOut - more resources
Full Text Sources
Medical