

Value of IVIM in Differential Diagnoses between Benign and Malignant Solitary Lung Nodules and Masses: A Meta-analysis
- PMID: 36017515
- PMCID: PMC9396547
- DOI: 10.3389/fsurg.2022.817443
Value of IVIM in Differential Diagnoses between Benign and Malignant Solitary Lung Nodules and Masses: A Meta-analysis
Abstract
Purpose: This study aims to evaluate the accuracy of intravoxel incoherent motion diffusion-weighted imaging (IVIM-DWI) in distinguishing malignant and benign solitary pulmonary nodules and masses.
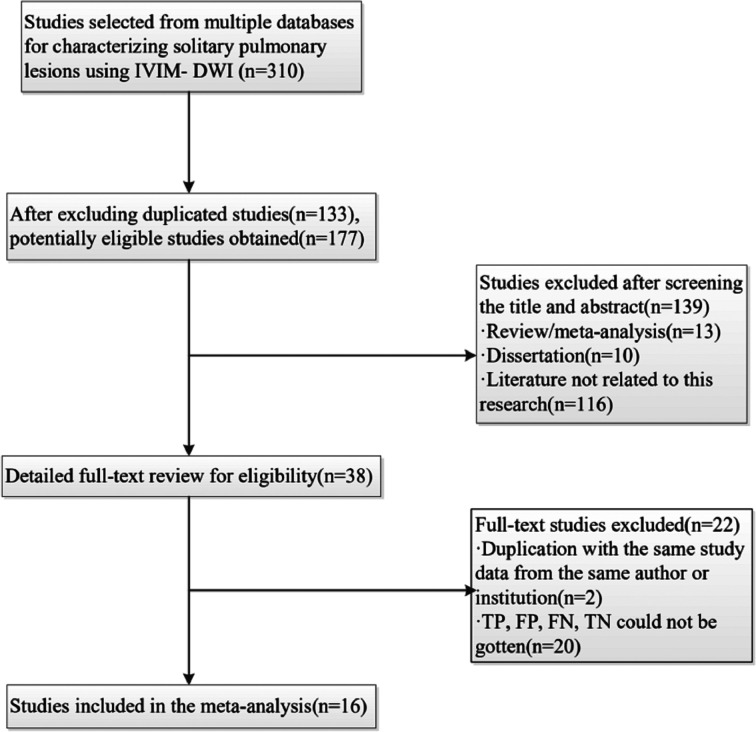
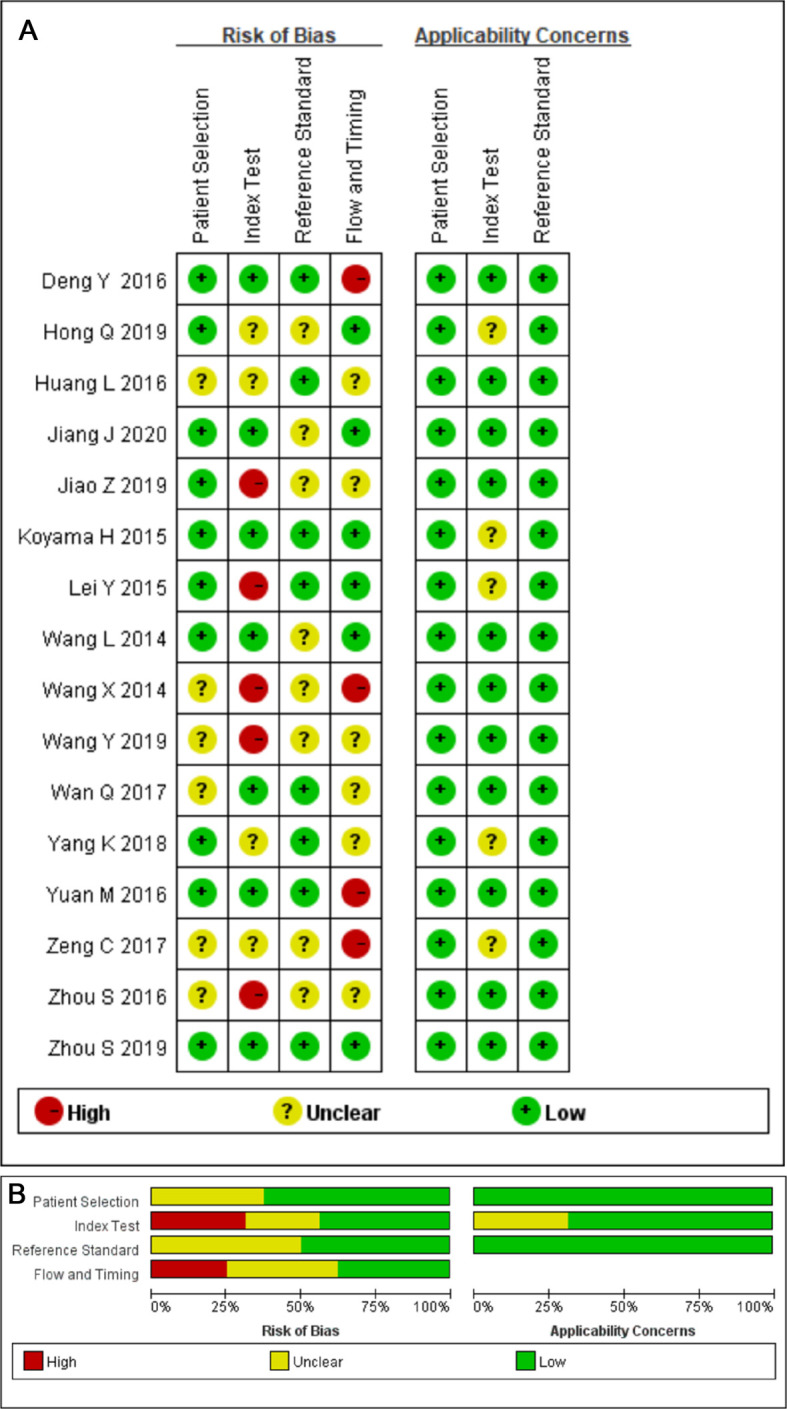
Methods: Studies investigating the diagnostic accuracy of IVIM-DWI in lung lesions published through December 2020 were searched. The standardized mean differences (SMDs) of the apparent diffusion coefficient (ADC), tissue diffusivity (D), pseudo-diffusivity (D*), and perfusion fraction (f) were calculated. The sensitivity, specificity, area under the curve (AUC), publication bias, and heterogeneity were then summarized, and the source of heterogeneity and the reliability of combined results were explored by meta-regression and sensitivity analysis.
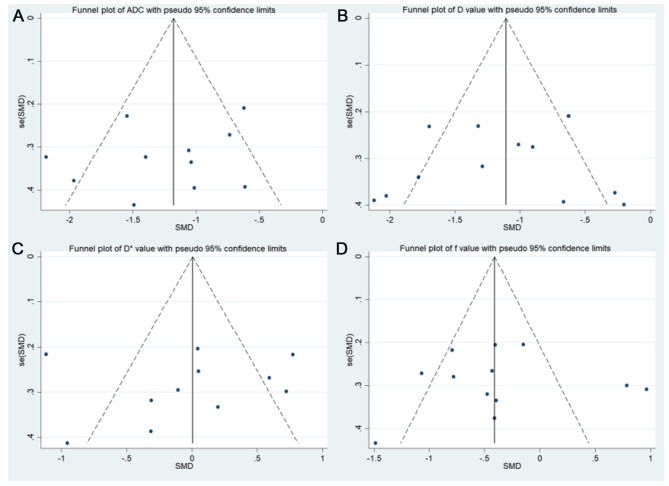
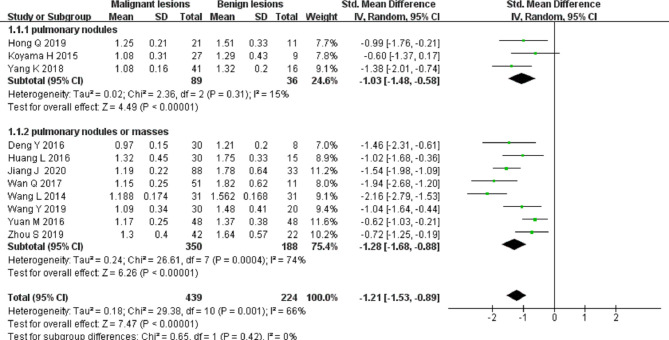
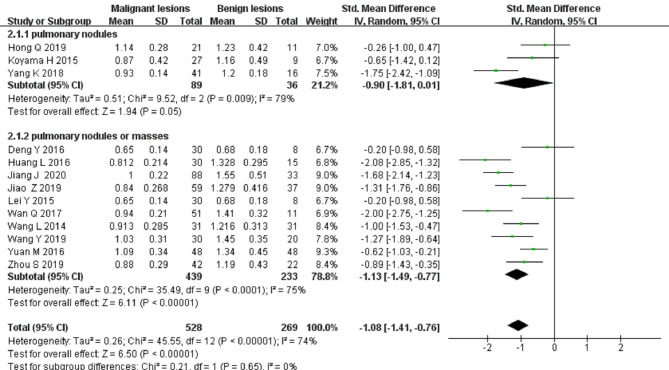
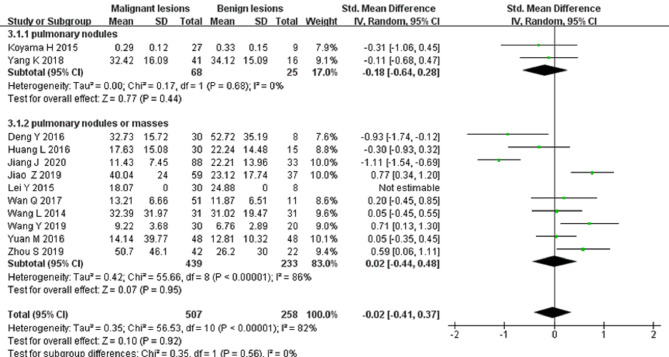
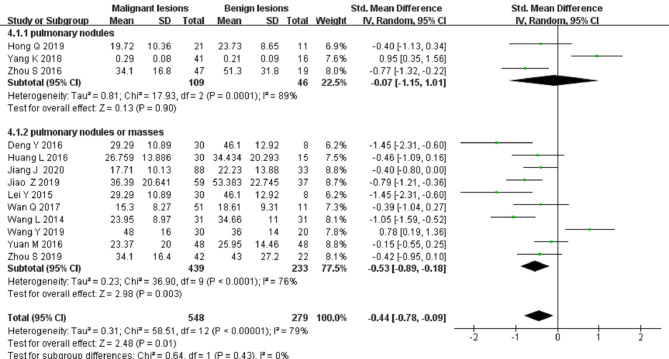
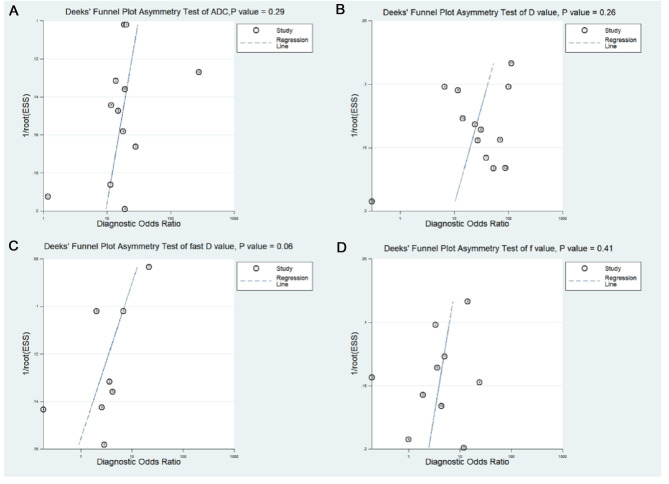
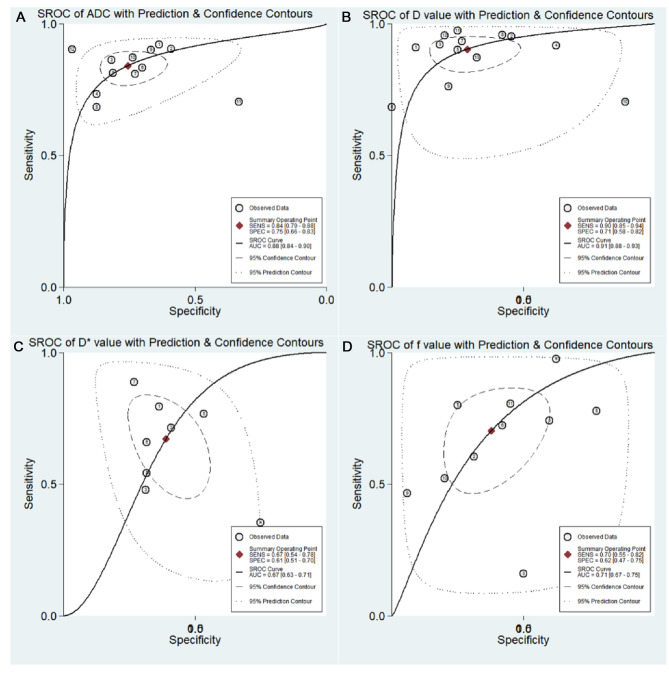
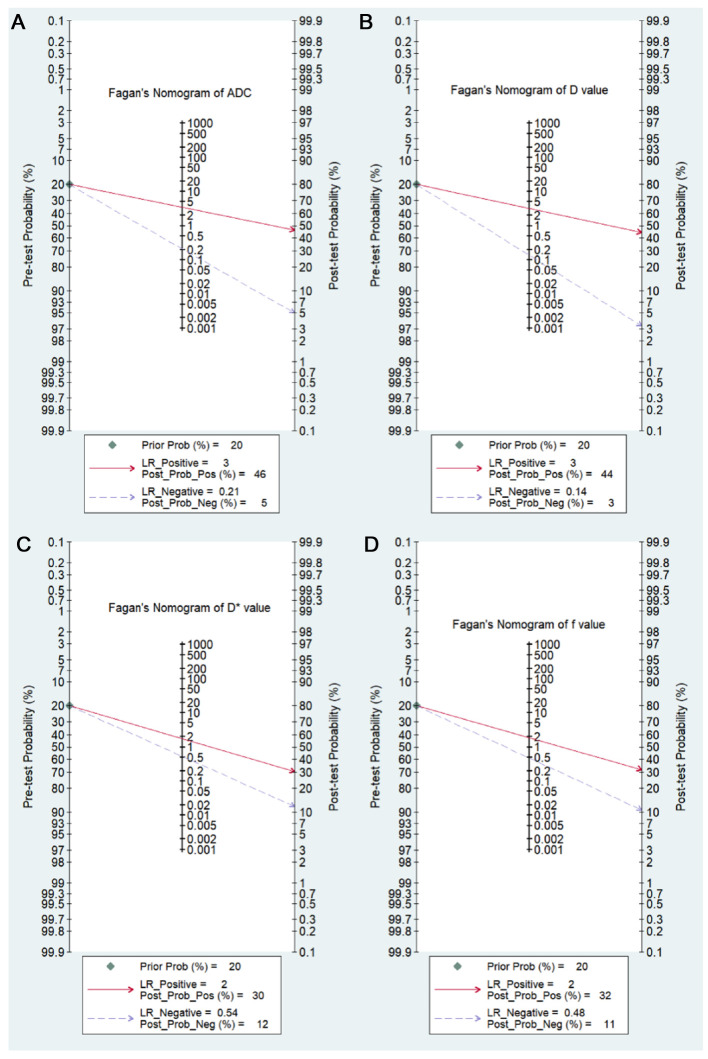
Results: A total of 16 studies including 714 malignant and 355 benign lesions were included. Significantly lower ADC, D, and f values were found in malignant pulmonary lesions compared to those in benign lesions. The D value showed the best diagnostic performance (sensitivity = 0.90, specificity = 0.71, AUC = 0.91), followed by ADC (sensitivity = 0.84, specificity = 0.75, AUC = 0.88), f (sensitivity = 0.70, specificity = 0.62, AUC = 0.71), and D * (sensitivity = 0.67, specificity = 0.61, AUC = 0.67). There was an inconspicuous publication bias in ADC, D, D* and f values, moderate heterogeneity in ADC, and high heterogeneity in D, D*, and f values. Subgroup analysis suggested that both ADC and D values had a significant higher sensitivity in "nodules or masses" than that in "nodules."
Conclusions: The parameters derived from IVIM-DWI, especially the D value, could further improve the differential diagnosis between malignant and benign solitary pulmonary nodules and masses.Systematic Review Registration: https://www.crd.york.ac.uk/PROSPERO/#myprospero, identifier: CRD42021226664.
Keywords: IVIM-DWI; differential diagnosis; lung nodules; magnetic resonance imaging; meta-analysis.
Copyright © 2022 Chen, Han, Huang, Lyu, Ai, Liang, Yan, Wang and Xiang.
Conflict of interest statement
The authors declare that the research was conducted in the absence of any commercial or financial relationships that could be construed as a potential conflict of interest.
Figures
Similar articles
-
Differentiating the lung lesions using Intravoxel incoherent motion diffusion-weighted imaging: a meta-analysis.BMC Cancer. 2020 Aug 24;20(1):799. doi: 10.1186/s12885-020-07308-z. BMC Cancer. 2020. PMID: 32831052 Free PMC article.
-
Intravoxel Incoherent Motion Diffusion-Weighted Imaging for Quantitative Differentiation of Breast Tumors: A Meta-Analysis.Front Oncol. 2020 Oct 20;10:585486. doi: 10.3389/fonc.2020.585486. eCollection 2020. Front Oncol. 2020. PMID: 33194733 Free PMC article.
-
Differentiating between malignant and benign solid solitary pulmonary lesions: are intravoxel incoherent motion and diffusion kurtosis imaging superior to conventional diffusion-weighted imaging?Eur Radiol. 2019 Mar;29(3):1607-1615. doi: 10.1007/s00330-018-5714-6. Epub 2018 Sep 25. Eur Radiol. 2019. PMID: 30255258
-
Intravoxel incoherent motion (IVIM) in evaluation of breast lesions: comparison with conventional DWI.Eur J Radiol. 2013 Dec;82(12):e782-9. doi: 10.1016/j.ejrad.2013.08.006. Epub 2013 Aug 13. Eur J Radiol. 2013. PMID: 24034833 Clinical Trial.
-
Intravoxel Incoherent Motion Diffusion-Weighted Imaging Used to Detect Prostate Cancer and Stratify Tumor Grade: A Meta-Analysis.Front Oncol. 2020 Sep 11;10:1623. doi: 10.3389/fonc.2020.01623. eCollection 2020. Front Oncol. 2020. PMID: 33042805 Free PMC article.
Cited by
-
Feasibility evaluation of intravoxel incoherent motion diffusion-weighted imaging in the diagnosis of skull-base invasion in nasopharyngeal carcinoma.J Cancer. 2023 Jan 9;14(2):290-298. doi: 10.7150/jca.80679. eCollection 2023. J Cancer. 2023. PMID: 36741262 Free PMC article.
-
Whole-lesion histogram analysis of multiple diffusion metrics for differentiating lung cancer from inflammatory lesions.Front Oncol. 2023 Jan 18;12:1082454. doi: 10.3389/fonc.2022.1082454. eCollection 2022. Front Oncol. 2023. PMID: 36741699 Free PMC article.
-
Translational Advances in Oncogene and Tumor-Suppressor Gene Research.Cancers (Basel). 2025 Mar 17;17(6):1008. doi: 10.3390/cancers17061008. Cancers (Basel). 2025. PMID: 40149342 Free PMC article. Review.
-
Monoexponential, biexponential, stretched exponential and diffusion kurtosis models of diffusion-weighted imaging: a quantitative differentiation of solitary pulmonary lesion.BMC Med Imaging. 2024 Dec 20;24(1):346. doi: 10.1186/s12880-024-01537-5. BMC Med Imaging. 2024. PMID: 39707237 Free PMC article.
-
The diagnostic efficacy of seven autoantibodies in early detection of ground-glass nodular lung adenocarcinoma.Front Oncol. 2024 Nov 26;14:1499140. doi: 10.3389/fonc.2024.1499140. eCollection 2024. Front Oncol. 2024. PMID: 39659784 Free PMC article.
References
Publication types
LinkOut - more resources
Full Text Sources