. 2022 Aug 26:11:e80229.
doi: 10.7554/eLife.80229.

Characterization of full-length CNBP expanded alleles in myotonic dystrophy type 2 patients by Cas9-mediated enrichment and nanopore sequencing

Affiliations

Characterization of full-length CNBP expanded alleles in myotonic dystrophy type 2 patients by Cas9-mediated enrichment and nanopore sequencing

Massimiliano Alfano et al. Elife. .

Abstract

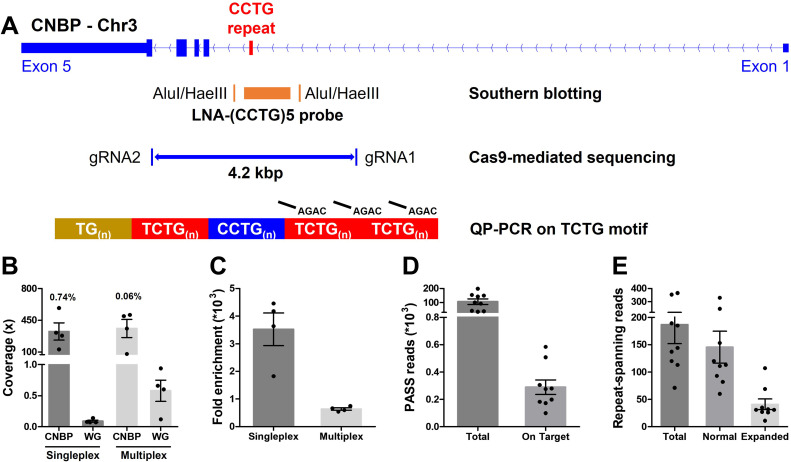
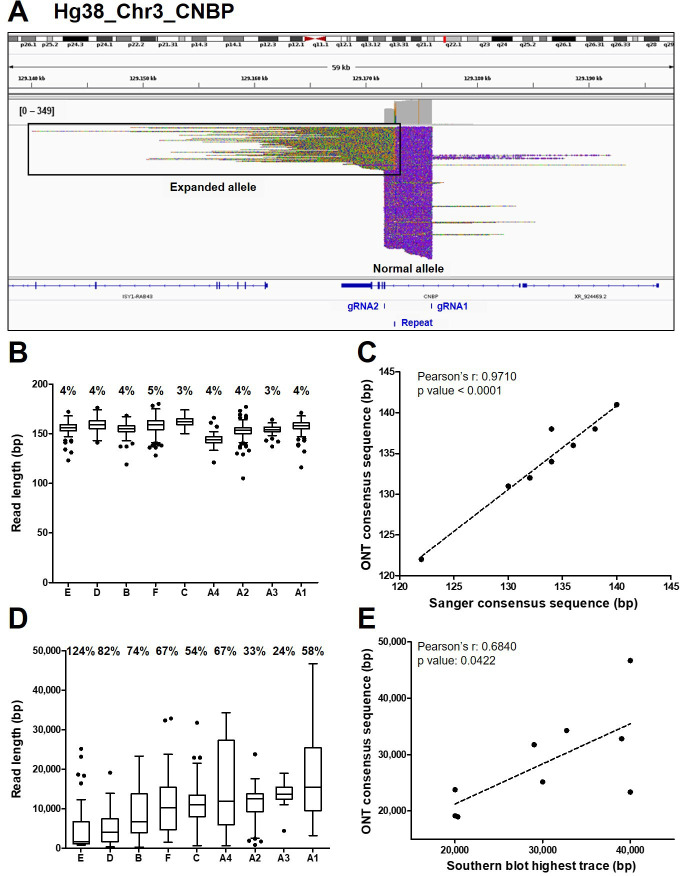
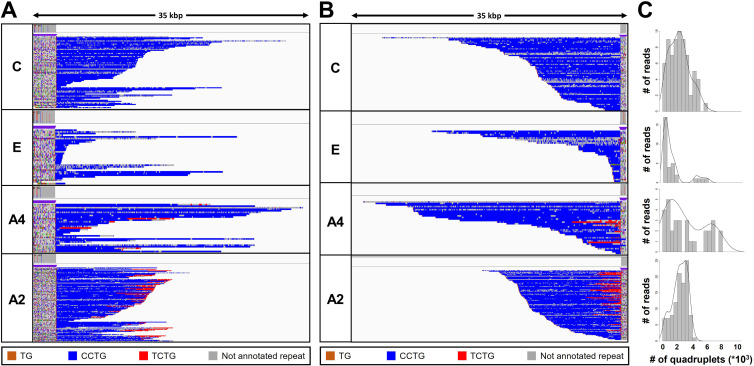
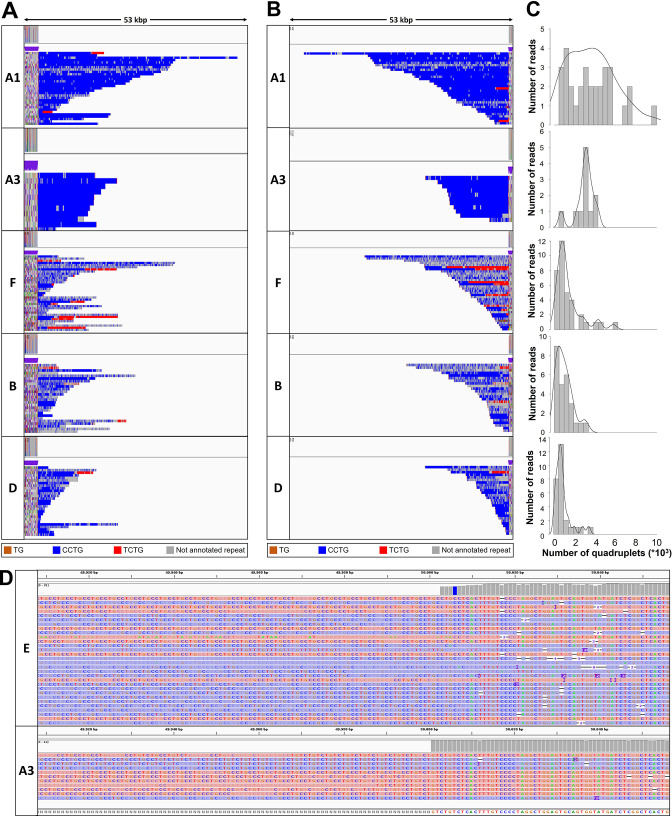
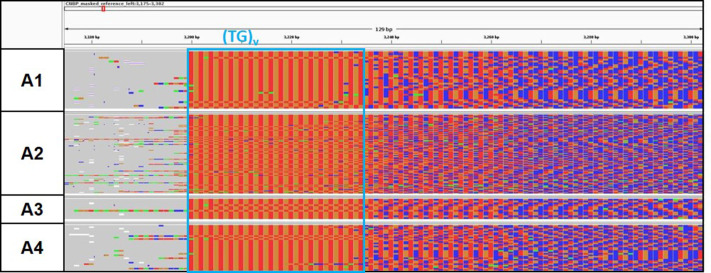
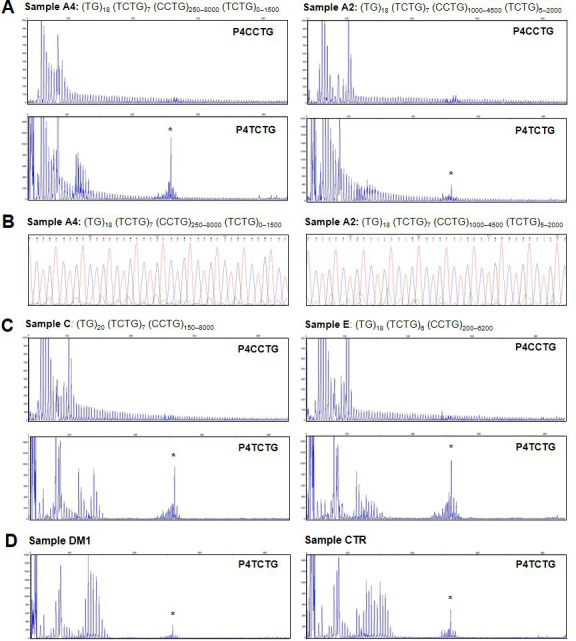
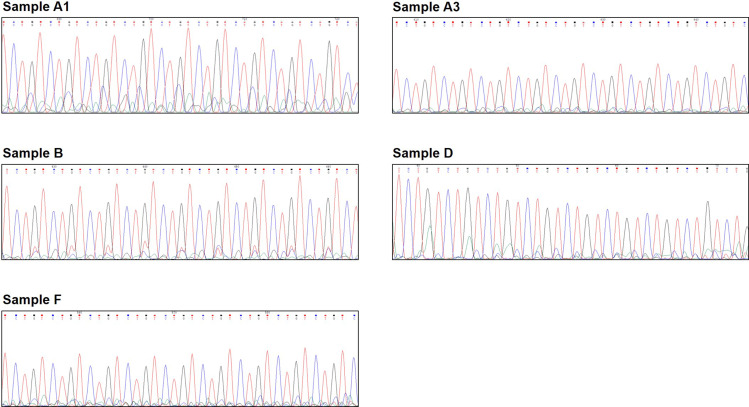
Myotonic dystrophy type 2 (DM2) is caused by CCTG repeat expansions in the CNBP gene, comprising 75 to >11,000 units and featuring extensive mosaicism, making it challenging to sequence fully expanded alleles. To overcome these limitations, we used PCR-free Cas9-mediated nanopore sequencing to characterize CNBP repeat expansions at the single-nucleotide level in nine DM2 patients. The length of normal and expanded alleles can be assessed precisely using this strategy, agreeing with traditional methods, and revealing the degree of mosaicism. We also sequenced an entire ~50 kbp expansion, which has not been achieved previously for DM2 or any other repeat-expansion disorders. Our approach precisely counted the repeats and identified the repeat pattern for both short interrupted and uninterrupted alleles. Interestingly, in the expanded alleles, only two DM2 samples featured the expected pure CCTG repeat pattern, while the other seven presented also TCTG blocks at the 3' end, which have not been reported before in DM2 patients, but confirmed hereby with orthogonal methods. The demonstrated approach simultaneously determines repeat length, structure/motif, and the extent of somatic mosaicism, promising to improve the molecular diagnosis of DM2 and achieve more accurate genotype-phenotype correlations for the better stratification of DM2 patients in clinical trials.

Keywords: CNBP gene; Cas9-mediated enrichment; genetics; genomics; human; myotonic dystrophy type 2; nanopore sequencing; repeat expansion.


Conflict of interest statement

MA, LD, FC, VV, SM, CD, RM, MD, GN, AB No competing interests declared, MD is a partner of Genartis srl, MR is a partner of Genartis srl, Verona

Figures

Figure 1.
Figure 1.. Cas9-mediated sequencing of the CNBP microsatellite.
(A) Experimental methods applied retrospectively to study the CNBP microsatellite in nine confirmed dystrophy type 2 (DM2) patients. The positions of AluI and HaeIII restriction sites (142 bp upstream and 108 bp downstream of the CCTG array, respectively) and the (CCTG)5 probe (orange rectangle) for Southern blot hybridization are shown, along with the gRNAs cleavage site for Cas9-mediated enrichment (boundaries of blue line = 4.2 kb) and the annealing position of P4TCTG primers for quadruplet-repeat primed PCR (QP-PCR). (B) Average coverage and (C) fold enrichment obtained by Cas9-mediated enrichment in DM2 patients following singleplex (n = 4) or multiplex (n = 4) runs. Numbers above bars represent the percentage of on-target reads. (D) Total and on-target number of PASS reads generated for each DM2 patient and (E) number of reads fully spanning the CNBP microsatellite and attributable to either the normal or expanded alleles. Data are plotted as means ± standard error of the mean (SEM). WG, whole genome. Sequencing statistics of singleplex and multiplex experiments are reported in detail in Supplementary file 1.
Figure 1—figure supplement 1.
Figure 1—figure supplement 1.. Pedigree of the dystrophy type 2 (DM2) family analyzed.
Genetic pedigree showing the relationship among A1–A4 familiar cases analyzed in this study. DNA sample from III-5 was not available for ONT sequencing.
Figure 1—figure supplement 2.
Figure 1—figure supplement 2.. Southern blot analysis of expanded alleles in dystrophy type 2 (DM2) patients.
(A) Restriction map of the DM2 locus indicating the AluI and HaeIII restriction sites used for the digestion of genomic DNA. (B) Southern blot analysis of genomic DNA double digested with AluI and HaeIII and probed with a digoxigenin (DIG)-labeled (CCTG)5 locked nucleic acid (LNA) probe. Lane 1, CTR, healthy control sample; lane 2, DM1 sample; lanes 3–11, DM2 samples. Molecular markers are indicated on the left. The original scan of the Southern blot analysis reported in panel B and the whole figure incorporating the original uncropped scan can be found in Figure 1—figure supplement 2—source data 1 and 2, respectively.
Figure 2.
Figure 2.. Analysis of ONT sequencing data from normal and expanded CNBP alleles.
(A) Integrative Genomics Viewer (IGV) visualization of ONT sequencing data at the CNBP locus of a representative dystrophy type 2 (DM2) patient following Cas9-mediated enrichment. Reads generated from the normal allele feature clear cuts on both sides of the CNBP repeat, whereas those derived from the expanded allele are longer, soft-clipped and do not match the reference genome, as expected. Length distributions of reads derived from the normal alleles (B) and expanded alleles (D) of each patient. Boxes represent the interquartile range (IQR) of lengths, the horizontal line is the median, whiskers and outliers are plotted according to Tukey’s method. (C) Correlation between the length of ONT and Sanger consensus sequences for the normal allele (n = 9). (E) Correlations between the maximum length of ONT sequences (longest complete read) and the upper edge of the Southern blot trace for the expanded allele (n = 9). Numbers on top of panels (B) and (D) indicate the coefficient of variation of normal and expanded alleles, respectively.
Figure 3.
Figure 3.. Analysis of the expanded-repeat CNBP alleles in dystrophy type 2 (DM2) patients.
Integrative Genomics Viewer (IGV) visualization (35-kbp windows) of ONT-targeted sequencing data from the expanded alleles of four representative DM2 patients. Complete reads were aligned at the 5′ end (A) and then at the 3′ end (B) in order to identify the repeat pattern that characterizes the expanded microsatellite locus. Each motif in the expanded alleles was visualized using a different color, as indicated in the key. Samples C and E contained a ‘pure’ CCTG expansion (blue) whereas samples A4 and A2 also contained the unexpected TCTG motif (red) downstream of CCTG. (C) Abundance of quadruplets identified in each patient. The y-axis shows the number of ONT reads with a certain number of repeats, whereas the x-axis shows the number of quadruplet repeats identified. ONT reads were grouped into 500 bp bins. The gray line represents the estimated kernel density of the underlying solid gray distribution of ONT reads.
Figure 3—figure supplement 1.
Figure 3—figure supplement 1.. Analysis of the CNBP repeat motif for the expanded alleles in dystrophy type 2 (DM2) patients.
Integrative Genomics viewer (IGV) visualization (53-kbp window) of ONT-targeted sequencing data from the expanded alleles of the five remaining DM2 samples. Complete reads were aligned at the 5′ end (A) and subsequently at the 3′ end (B) in order to identify the repeat pattern characterizing the expanded microsatellite locus. Each motif in the expanded alleles was visualized using a different color, as indicated in the key. All samples feature the unexpected TCTG motif of variable length downstream of the CCTG motif. (C) Abundance of quadruplets identified in each patient. The y-axis shows the number of ONT reads with a certain number of repeats, whereas the x-axis shows the number of quadruplet repeats identified. ONT reads were grouped into 500 bp bins. The gray line represents the estimated kernel density of the underlying solid gray distribution of ONT reads. (D) IGV visualization of ONT-targeted sequencing data from the expanded alleles of two representative patients (E and A3) carrying a pure CCTG expansion and a repeat with the TCTG motif, respectively.
Figure 3—figure supplement 2.
Figure 3—figure supplement 2.. Analysis of the CNBP 5′-end (TG)v repeat motif of the CNBP expanded alleles of A1–A4 dystrophy type 2 (DM2) family members.
Integrative Genomics viewer (IGV) visualization (~130 bp window) of ONT-targeted sequencing data from the expanded alleles of the DM2 family members. Complete reads were aligned at the 5′ end in order to identify the repeat pattern characterizing the expanded microsatellite locus. Nucleotides of the expanded repeat have been colored with A: green, C: blue, G: orange, and T: red.
Figure 4.
Figure 4.. Analysis of the TCTG motif by quadruplet-repeat primed PCR (QP-PCR) and Sanger sequencing.
(A) Representative QP-PCR profiles of genomic DNA samples from patients A2 and A4 and showing the presence of the TCTG block. Upper panels show QP-PCR results using the conventional P4CCTG primer. Lower panels show QP-PCR results using primer P4TCTG. (B) Sanger sequencing of the QP-PCR products from P4TCTG reaction confirming the presence of the TCTG sequence. (C) QP-PCR profiles of genomic DNA samples from patients C and E showing only the traditional dystrophy type 2 (DM2) motif CCTG. For each patient, the composition of CNBP expanded alleles above the QP-PCR tracks reflects the ONT sequencing data. Asterisks (*) indicate nonspecific signals, also visible in the QP-PCR profiles of DM1 and CTR samples (D).
Figure 4—figure supplement 1.
Figure 4—figure supplement 1.. Sanger sequencing of quadruplet-repeat primed PCR (QP-PCR) products showing the presence of the (TCTG)n motif.
QP-PCR was carried out using primer P4TCTG and genomic DNA from dystrophy type 2 (DM2) patients A1, A3, B, D, and F. Sanger sequencing of the QP-PCR products confirmed the presence of the (TCTG)n array at the 3′ end of the (CCTG) expansions.

References

    1. Addis M, Serrenti M, Meloni C, Cau M, Melis MA. Triplet-primed PCR is more sensitive than southern blotting-long PCR for the diagnosis of myotonic dystrophy type1. Genetic Testing and Molecular Biomarkers. 2012;16:1428–1431. doi: 10.1089/gtmb.2012.0218. - DOI - PubMed
    1. Bachinski LL, Udd B, Meola G, Sansone V, Bassez G, Eymard B, Thornton CA, Moxley RT, Harper PS, Rogers MT, Jurkat-Rott K, Lehmann-Horn F, Wieser T, Gamez J, Navarro C, Bottani A, Kohler A, Shriver MD, Sallinen R, Wessman M, Zhang S, Wright FA, Krahe R. Confirmation of the type 2 myotonic dystrophy (CCTG)n expansion mutation in patients with proximal myotonic myopathy/proximal myotonic dystrophy of different european origins: A single shared haplotype indicates an ancestral founder effect. American Journal of Human Genetics. 2003;73:835–848. doi: 10.1086/378566. - DOI - PMC - PubMed
    1. Ballester-Lopez A, Koehorst E, Almendrote M, Martínez-Piñeiro A, Lucente G, Linares-Pardo I, Núñez-Manchón J, Guanyabens N, Cano A, Lucia A, Overend G, Cumming SA, Monckton DG, Casadevall T, Isern I, Sánchez-Ojanguren J, Planas A, Rodríguez-Palmero A, Monlleó-Neila L, Pintos-Morell G, Ramos-Fransi A, Coll-Cantí J, Nogales-Gadea G. A DM1 family with interruptions associated with atypical symptoms and late onset but not with A milder phenotype. Human Mutation. 2020;41:420–431. doi: 10.1002/humu.23932. - DOI - PubMed
    1. Benson G. Tandem repeats finder: A program to analyze DNA sequences. Nucleic Acids Research. 1999;27:573–580. doi: 10.1093/nar/27.2.573. - DOI - PMC - PubMed
    1. Botta A, Bonifazi E, Vallo L, Gennarelli M, Garrè C, Salehi L, Iraci R, Sansone V, Meola G, Novelli G. Italian guidelines for molecular analysis in myotonic dystrophies. Acta Myologica. 2006;25:23–33. - PubMed