. 2023 Mar;18(3):634-642.
doi: 10.4103/1673-5374.350210.

Chronic spinal cord compression associated with intervertebral disc degeneration in SPARC-null mice

Affiliations

Chronic spinal cord compression associated with intervertebral disc degeneration in SPARC-null mice

Zhuo-Yao Li et al. Neural Regen Res. 2023 Mar.

Abstract

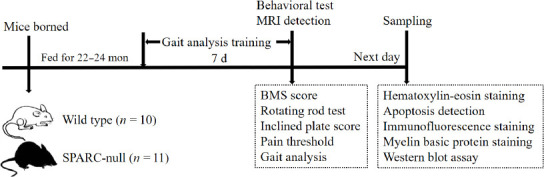
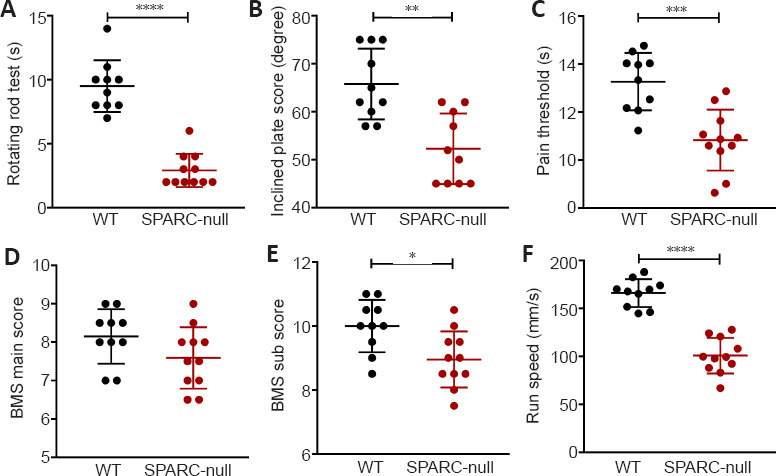
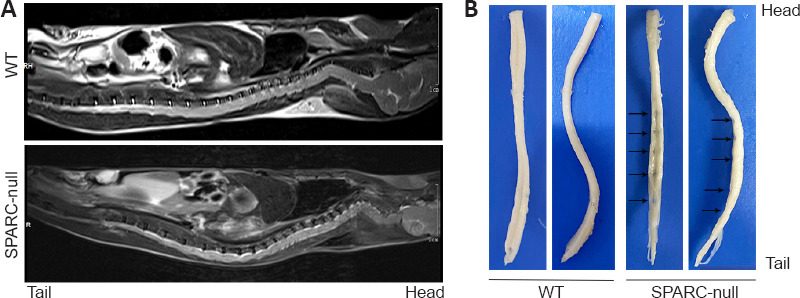
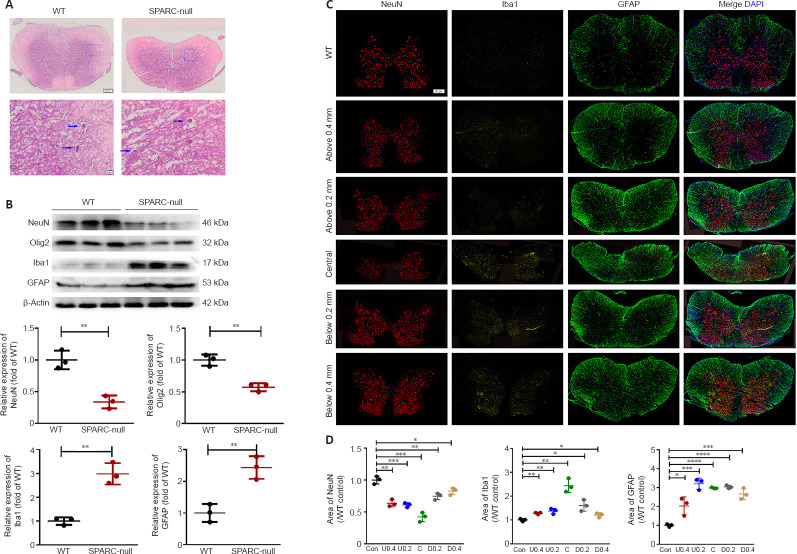
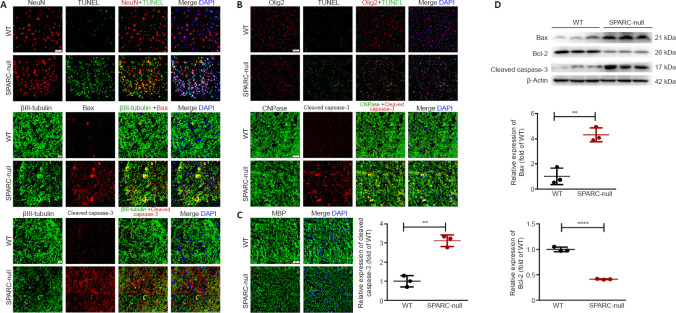
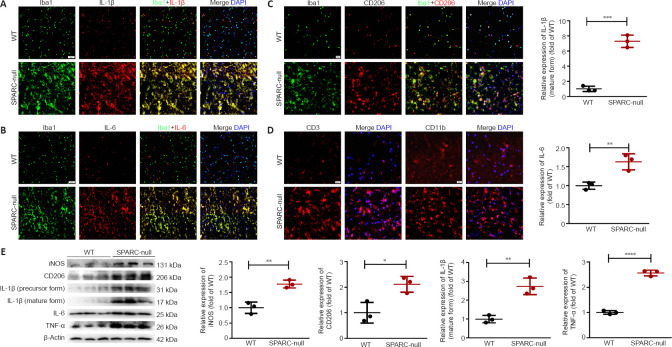
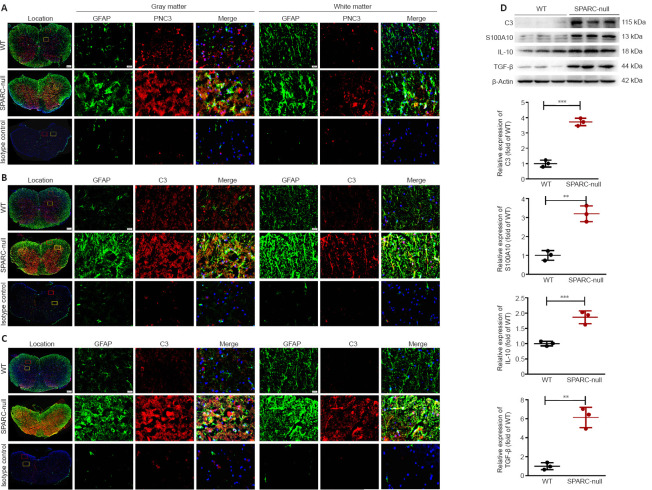
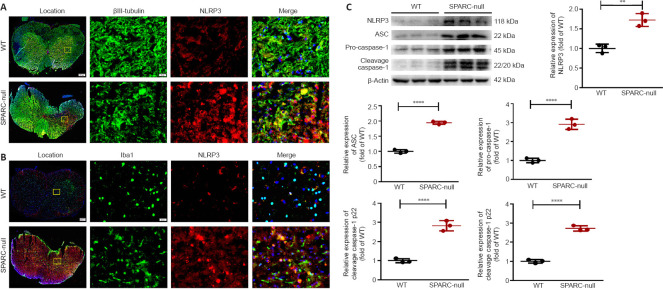
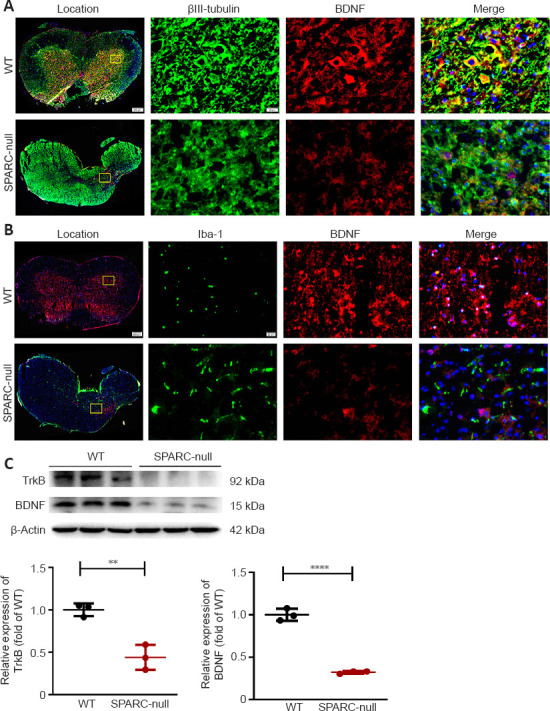
Chronic spinal cord compression (CSCC) is induced by disc herniation and other reasons, leading to movement and sensation dysfunction, with a serious impact on quality of life. Spontaneous disc herniation rarely occurs in rodents, and therefore establishing a chronic spinal cord compression (CSCC) animal model is of crucial importance to explore the pathogenesis and treatment of CSCC. The absence of secreted protein, acidic, and rich in cysteine (SPARC) leads to spontaneous intervertebral disc degeneration in mice, which resembles human disc degeneration. In this study, we evaluated whether SPARC-null mice may serve as an animal model for CSCC. We performed rod rotation test, pain threshold test, gait analysis, and Basso Mouse Scale score. Our results showed that the motor function of SPARC-null mice was weakened, and magnetic resonance images revealed compression at different spinal cord levels, particularly in the lumbar segments. Immunofluorescence staining and western blot assay showed that the absence of SPARC induced apoptosis of neurons and oligodendrocytes, activation of microglia/macrophages with M1/M2 phenotype and astrocytes with A1/A2 phenotype; it also activated the expression of the NOD-like receptor protein 3 inflammasome and inhibited brain-derived neurotrophic factor/tyrosine kinase B signaling pathway. Notably, these findings are characteristics of CSCC. Therefore, we propose that SPARC-null mice may be an animal model for studying CSCC caused by disc herniation.

Keywords: acidic; and rich in cysteine; apoptosis; astrocytes; chronic spinal cord compression; disc degeneration; disc herniation; macrophages; microglia; neuroinflammation; neurons; NOD-like receptor protein 3 inflammasomes; secreted protein.


Conflict of interest statement

None

Figures

Figure 1
Figure 1
A schematic for the experimental analyses. BMS: Basso Mouse Scale; MRI: magnetic resonance imaging; SPARC: secreted protein, acidic and rich in cysteine.
Figure 2
Figure 2
SPARC-null mice exhibit motor dysfunction. (A) Residence time on the stick in the rotating rod test. (B) The inclined plate score in the inclined plate test. (C) The pain threshold in the pain threshold test. (D, E) The BMS main (D) and sub (E) scores. (F) Running speed based on gait analysis before sampling. Data are shown as mean ± SD (n = 11 in the SPARC-null group, n = 10 in the WT group). *P < 0.05, **P < 0.01, ***P < 0.001, ****P < 0.0001 (Student’s t-test). BMS: Basso Mouse Scale; SPARC: secreted protein, acidic and rich in cysteine; WT: wild-type.
Figure 3
Figure 3
The absence of SPARC induces disc herniation in mice. (A) MRI of the entire spine of mice. (B) The whole segment of the spinal cord after sampling and fixation. Compression was seen at different spinal cord levels, especially in the lumbar segments, in SPARC-null mice compared with the WT control. The arrows show traces of spinal cord compression. MRI: Magnetic resonance imaging; SPARC: secreted protein, acidic and rich in cysteine.
Figure 4
Figure 4
Distribution of spinal cord cells in the L2/3 level in SPARC-null mice. (A) HE staining of compression sites. Compression of the spinal cord was confirmed by HE staining. Blue arrows indicate neurons. Scale bar: 500 µm in the spinal cord overall view, and 20 µm in gray matter. (B) Western blot and quantitative analysis of NeuN, Olig2, Iba1, and GFAP in the spinal cord. Protein expression was normalized to β-actin. (C) Distribution of neurons, microglia, and astrocytes marked with NeuN (red), Iba1 (yellow), and GFAP (green), respectively, 0.2 mm and 0.4 mm above and below the spinal cord compression center. Scale bar: 500 µm. (D) Quantitative analysis of neurons, microglia/macrophages, and astrocytes. Data were normalized to the area of NeuN, Iba1, and GFAP in WT control. Data are shown as mean ± SD (n = 3 mice in each group). *P < 0.05, **P < 0.01, ***P < 0.001, ****P < 0.0001 (Student’s t-test). GFAP: Glial fibrillary acidic protein; HE: hematoxylin-eosin; Iba1: ionized calcium binding adapter molecule 1; NeuN: neuronal nuclei; Olig2: oligodendrocyte transcriptional factor-2; SPARC: secreted protein, acidic and rich in cysteine; WT: wild-type.
Figure 5
Figure 5
Apoptosis and demyelination in the spinal cord at L2/3 level caused by the absence of SPARC. (A) TUNEL staining with NeuN and immunofluorescence staining of βIII-tubulin (green), Bax (red), and cleaved caspase-3 (red). TUNEL-positive cells were observed and apoptosis-related proteins Bax and cleaved caspase-3 expression were increased in SPARC-null mouse neurons compared with WT mice. Scale bar: 50 µm in TUNEL staining; 20 µm in others. (B) TUNEL staining with Olig2 (red) and immunofluorescence staining of CNPase (green) with cleaved caspase-3 (red). TUNEL-positive cells were observed in SPARC-null mice oligodendrocytes and cleaved caspase-3 expression was increased in SPARC-null mice oligodendrocytes compared with WT mice. Scale bar: 100 µm in TUNEL staining; 50 µm in other panels. (C) Immunofluorescence staining for MBP (green). MBP was less integrated in SPARC-null mice compared with WT mice. Scale bar: 50 µm. (D) Western blot and quantitative analysis (normalized to β-actin) of Bax, Bcl-2, and cleaved caspase-3. Data are shown as mean ± SD (n = 3 mice in each group). **P < 0.01, ****P < 0.0001 (Student’s t-test). CNPase: 2-3-Cyclic nucleotide 3-phosphodiesterase; MBP: myelin basic protein; NeuN: neuronal nuclei; Olig2: oligodendrocyte transcriptional factor-2; SPARC: secreted protein, acidic and rich in cysteine; Tunel: terminal deoxynucleotidyl transferase-mediated deoxyuridine triphosphate-nick end labeling staining; WT: wild-type.
Figure 6
Figure 6
Neuroinflammation at the L2/3 level caused by the absence of SPARC. (A–C) Immunofluorescence staining for Iba1 (green) with IL-1β, IL-6, and CD206 (red). The levels of Iba1, IL-1β, and IL-6 with Iba1 (markers of M1 phenotype microglia/macrophages) were significantly increased in SPARC-null mice compared with WT control. (D) Immunofluorescence staining for CD3 and CD11b (red). Scale bar: 20 µm. (E) Western blot and quantitative analysis of iNOS, CD206, IL-1β, IL-6, and TNF-α (normalized to β-actin). Data are shown as mean ± SD (n = 3 mice in each group). *P < 0.05, **P < 0.01, ***P < 0.001 (Student’s t-test). Iba1: Ionized calcium binding adapter molecule 1; IL: interleukin; iNOS: inducible nitric oxide synthase; SPARC: secreted protein, acidic and rich in cysteine; TNF-α: tumor necrosis factor-α; WT: wild-type.
Figure 7
Figure 7
Astrocyte activation in L2/3 level in SPARC-null mice. (A–C) Immunofluorescence staining of GFAP with PCNA, C3, and S100A10. The expression of the astrocyte marker GFAP (green) was increased both in white and gray matter in SPARC-null mice compared with WT mice, PCNA, C3, and S100A10 (red) were significantly increased in SPARC-null mice. Scale bars: 500 µm in spinal cord overall view, 20 µm in gray and white matter. (D) Western blot and quantitative analysis of C3, S100A10, IL-10, and TGF-β (normalized to β-actin). Data are shown as mean ± SD (n = 3 mice in each group). **P < 0.01, ***P < 0.001 (Student’s t-test). C3: Complement component 3; GFAP: glial fibrillary acidic protein; IL-10: interleukin-10; PCNA: proliferating cell nuclear antigen; S100A10: soluble protein-100α10; SPARC: secreted protein, acidic and rich in cysteine; TGF-β: transforming growth factor-beta; WT: wild-type.
Figure 8
Figure 8
The absence of SPARC activates NLRP3 inflammasomes at the L2/3 level in spinal cord. (A) Immunofluorescence staining of Iba1 (green) with NLRP3 (red). NLRP3 expression was low in WT mice, while it was enhanced in neurons of SPARC-null mice, especially in the compression part. (B) Immunofluorescence staining of βIII-tubulin (green) with NLRP3 (red). NLRP3 expression was low in WT mice, while it was enhanced in microglia of SPARC-null mice, especially in the compression part. Scale bars: 20 µm. (C) Western blot and quantitative analysis of NLRP3, ASC, pro caspase-1, and cleavage caspase-1 (normalized to β-actin). Data are shown as mean ± SD (n = 3 mice in each group). **P < 0.01, ****P < 0.0001 (Student’s t-test). ASC: Apoptosis-associated speck-like protein containing a CARD; Iba1: ionized calcium binding adapter molecule 1; NLRP3: NOD-like receptor protein 3; SPARC: Secreted protein, acidic and rich in cysteine; WT: wild-type.
Figure 9
Figure 9
The absence of SPARC inhibits the BDNF/TrkB signaling pathway at the L2/3 level in spinal cord. (A) Immunofluorescence staining of βIII-tubulin (green) with BDNF (red). Lower BDNF expression was observed in SPARC-null mice compared with WT mice in the whole spinal cord in neurons. (B) Immunofluorescence staining of Iba1 (green) with BDNF (red). Lower BDNF expression was observed in SPARC-null mice compared with WT mice in the whole spinal cord in microglia. Scale bars: 20 µm. (C) Western blot and quantitative analysis of BDNF and TrkB. Data are normalized to β-actin and shown as mean ± SD (n = 3 mice in each group). **P < 0.01, ****P < 0.0001 (Student’s t-test). BDNF: Brain-derived neurotrophic factor; SPARC: secreted protein, acidic and rich in cysteine; TrkB: tropomyosin related kinase B; WT: wild-type.

Similar articles

Cited by

References

    1. Adams BL, Guo W, Gors RT, Knopp KL. Pharmacological interrogation of a rodent forced ambulation model:leveraging gait impairment as a measure of pain behavior pre-clinically. Osteoarthritis Cartilage. 2016;24:1928–1939. - PubMed
    1. Alvarez-Garcia O, Matsuzaki T, Olmer M, Masuda K, Lotz MK. Age-related reduction in the expression of FOXO transcription factors and correlations with intervertebral disc degeneration. J Orthop Res. 2017;35:2682–2691. - PMC - PubMed
    1. Bacova M, Bimbova K, Kisucka A, Lukacova N, Galik J. Epidural oscillating field stimulation increases axonal regenerative capacity and myelination after spinal cord trauma. Neural Regen Res. 2022;17:2730–2736. - PMC - PubMed
    1. Basso DM, Fisher LC, Anderson AJ, Jakeman LB, McTigue DM, Popovich PG. Basso Mouse Scale for locomotion detects differences in recovery after spinal cord injury in five common mouse strains. J Neurotrauma. 2006;23:635–659. - PubMed
    1. Bednarik J, Kadanka Z, Dusek L, Kerkovsky M, Vohanka S, Novotny O, Urbanek I, Kratochvilova D. Presymptomatic spondylotic cervical myelopathy:an updated predictive model. Eur Spine J. 2008;17:421–431. - PMC - PubMed