. 2022 Aug 26;8(34):eabo1543.
doi: 10.1126/sciadv.abo1543. Epub 2022 Aug 26.

PRC2-mediated repression is essential to maintain identity and function of differentiated dopaminergic and serotonergic neurons

Affiliations

PRC2-mediated repression is essential to maintain identity and function of differentiated dopaminergic and serotonergic neurons

Konstantinos Toskas et al. Sci Adv. .

Abstract

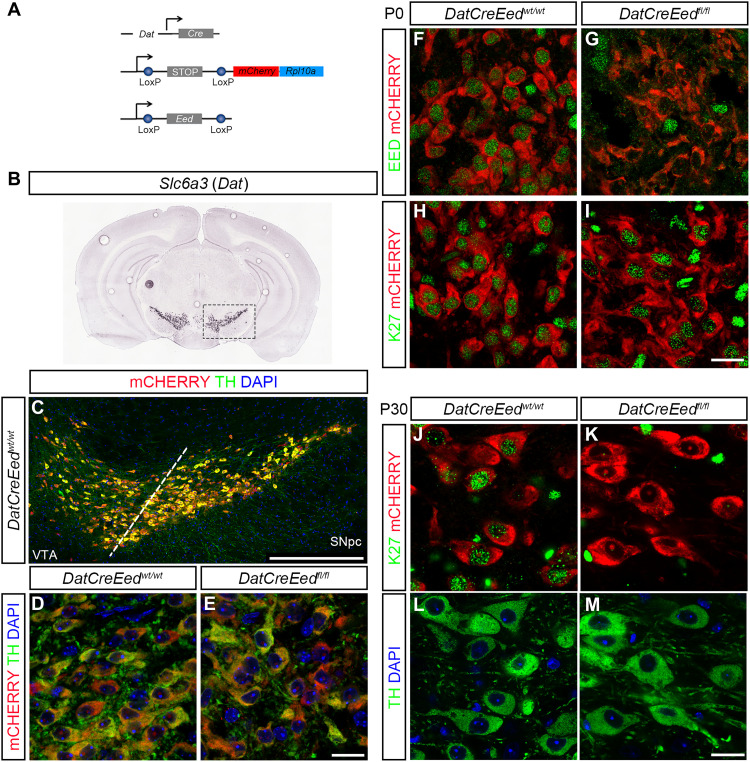
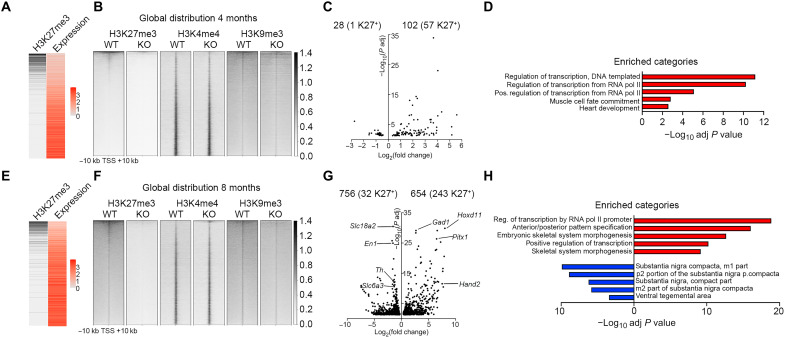
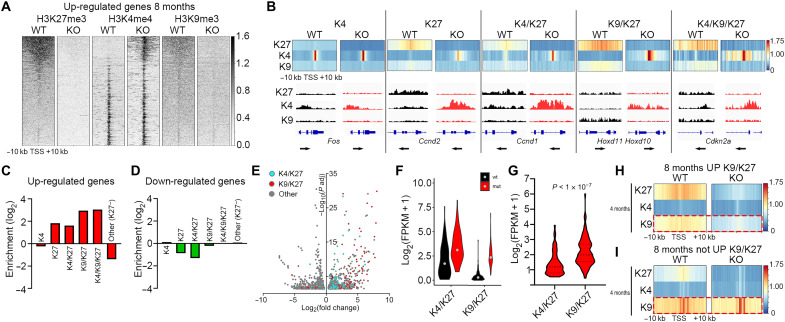
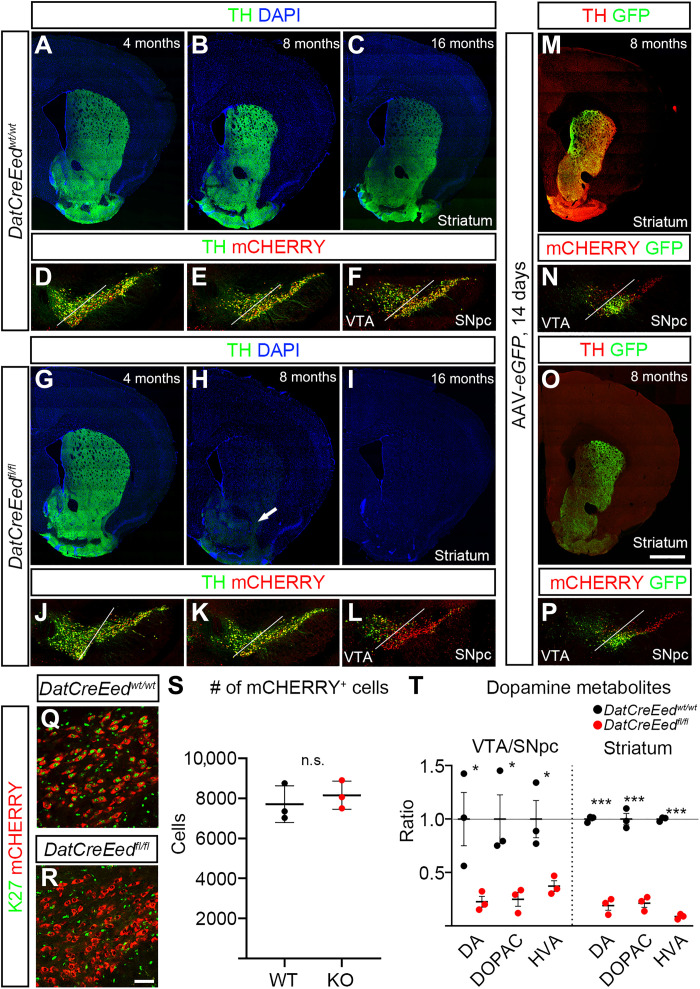
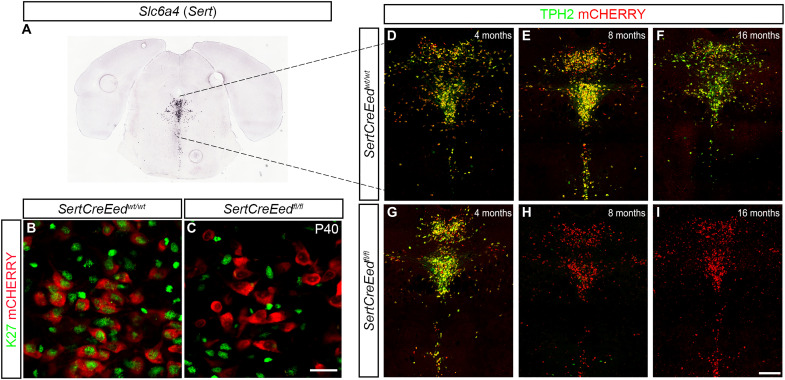
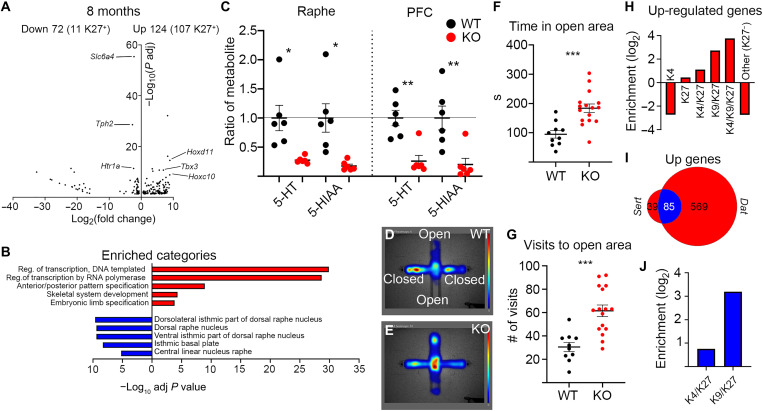
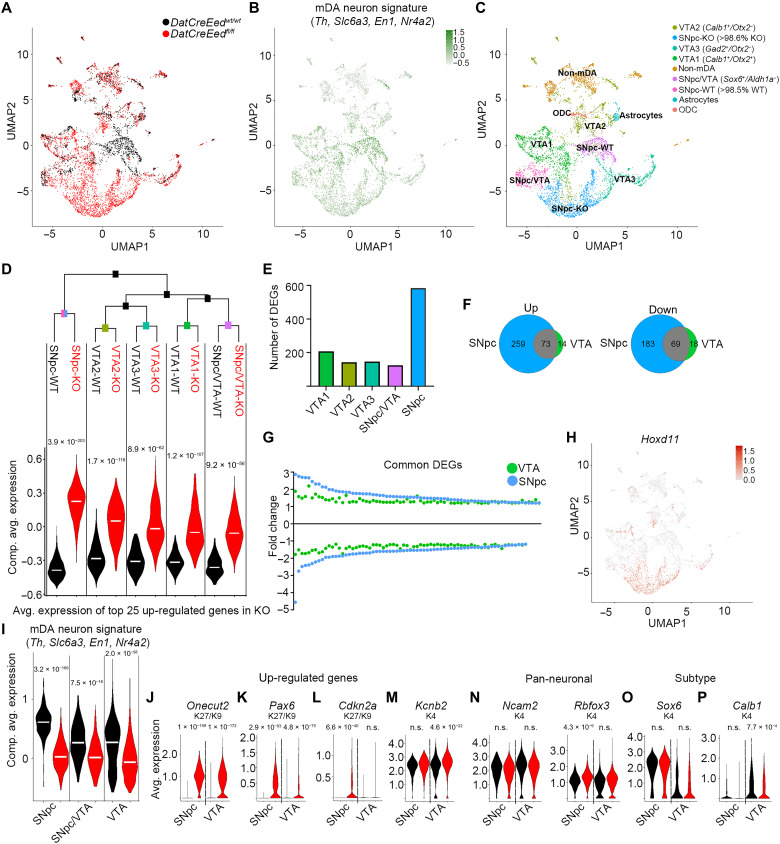
How neurons can maintain cellular identity over an entire life span remains largely unknown. Here, we show that maintenance of identity in differentiated dopaminergic and serotonergic neurons is critically reliant on the Polycomb repressive complex 2 (PRC2). Deletion of the obligate PRC2 component, Eed, in these neurons resulted in global loss of H3K27me3, followed by a gradual activation of genes harboring both H3K27me3 and H3K9me3 modifications. Notably, H3K9me3 was lost at these PRC2 targets before gene activation. Neuronal survival was not compromised; instead, there was a reduction in subtype-specific gene expression and a progressive impairment of dopaminergic and serotonergic neuronal function, leading to behavioral deficits characteristic of Parkinson's disease and anxiety. Single-cell analysis revealed subtype-specific vulnerability to loss of PRC2 repression in dopamine neurons of the substantia nigra. Our study reveals that a PRC2-dependent nonpermissive chromatin state is essential to maintain the subtype identity and function of dopaminergic and serotonergic neurons.


Figures

Fig. 1.
Fig. 1.. Deletion of Eed leads to progressive loss of H3K27me3 in differentiated mDA neurons.
(A) Schematic representation of the three constructs used to generate the mutant mice. (B) In situ hybridization for Slc6a3 (Dat) taken from the Allen Brain Atlas (mouse.brain-map.org, image credit: Allen Institute). (C) Immunostaining of the ventral midbrain in DatCreEedwt/wt as indicated by the box in (B), showing overlap between mCHERRY and TH. DAPI, 4′,6-diamidino-2-phenylindole. (D and E) Immunostaining at ×63 magnification showing overlap of TH and mCHERRY in the SNpc of DatCreEedwt/wt mice (D) and DatCreEedfl/f mice (E). (F) mDA neurons double positive for EED and mCHERRY immunostaining at P0 in DatCreEedwt/wt SNpc. (G) Loss of EED in mCHERRY+ cells at P0 in DatCreEedft/fl SNpc. (H) mDA neurons double positive for H3K27me3 and mCHERRY immunostaining at P0 in DatCreEedwt/wt SNpc. (I) mDA neurons double positive for H3K27me3 and mCHERRY immunostaining at P0 in DatCreEedfl/fl SNpc. (J) mDA neurons double positive for H3K27me3 and mCHERRY immunostaining at P30 in DatCreEedwt/wt SNpc. (K) Loss of H3K27me3 in mCHERRY+ cells at P30 in DatCreEedfl/fl SNpc. (L) Staining with TH and DAPI of the DatCreEedwt/wt cells from (J). (M) Staining with TH and DAPI of the DatCreEedfl/fl cells from (K). Scale bars, 20 μm (E, I, and M).
Fig. 2.
Fig. 2.. Loss of Eed results in progressive up-regulation of PRC2 targets and reduced expression of mDA neuronal genes.
(A) Heatmaps showing inverse correlation between H3K27me3 and expression levels at 4 months in DatCreEedwt/wt. (B) Genome-wide abundance of histone modifications at 4 months in DatCreEedwt/wt (WT) and DatCreEedfl/fl [knockout (KO)] in 20-kb regions centered on TSS of individual genes ranked by H3K27me3 abundance in WT. (C) Volcano plot showing DEGs at 4 months in isolated mCHERRY+ nuclei from KO ventral midbrain. Numbers of up- and down-regulated genes are indicated above the plot, with the number of H3K27me3+ genes in WT at 4 months within brackets. (D) Enriched categories (GO biological process) for up-regulated genes are characterized by activation of transcription and early developmental non-neuronal processes. (E) Heatmaps showing inverse correlation between H3K27me3 and expression levels at 8 months in WT. Heatmap for H3K27me3 as in (A), with promoter chromatin states at 8 months. (F) Genome-wide abundance of histone modifications at 8 months in WT and KO as in (B). (G) Volcano plot showing DEGs at 8 months in isolated mCHERRY+ nuclei from KO ventral midbrain. Numbers of up- and down-regulated genes are indicated above the plot, with the number of H3K27me3+ genes in WT at 8 months within brackets. Examples of up-regulated genes that are PRC2 targets in WT mDA neurons at 8 months are labeled on the right side of the plot. Examples of down-regulated mDA identity genes are labeled on the left side of the plot. (H) Enriched categories for up-regulated genes (red) (GO biological process) and down-regulated genes (blue) (Up in Allen Brain Atlas, as calculated by Enrichr).
Fig. 3.
Fig. 3.. Combined H3K9me3/H3K27me3 is associated with higher probability of derepression upon loss of PRC2 activity.
(A) Heatmaps showing abundance of H3K27me3, H3K4me3, and H3K9me3 at genes up-regulated in 8-month KO in 20-kb regions centered on the TSS of individual genes ranked by H3K27me3 abundance in WT. (B) Heatmap profiles of average H3K27me3, H3K4me3, and H3K9me3 RPKMs ±10 kb around the TSS of genes up-regulated in 8-month KO per defined chromatin state (denoted as K4, K27, K4/K27, K9/K27, and K4/K9/K27) in 8-month WT and how these states are resolved in 8-month KO. Below each chromatin state, Integrative Genomics Viewer tracks exemplify how the histone marker abundances compare at representative genes between WT and KO. (C) Enrichment/depletion of chromatin states for up-regulated genes in KO mDA cells at 8 months. (D) Enrichment/depletion of chromatin states for down-regulated genes in KO mDA cells at 8 months. (E) Volcano plot as in Fig. 2G showing DEGs belonging to H3K4me3/H3K27me3 (cyan) or H3K9me3/H3K27me3 (red) chromatin states in 8-month WT mDA cells. (F) Violin plot showing the absolute expression level [log2(FPKM + 1)] of up-regulated genes in KO mDA cells belonging to K4/K27 or K9/K27 chromatin states in 8-month WT mDA cells. (G) Difference (Δ) in gene expression between WT and KO of genes belonging to the K4/K27 or K9/K27 states at 8 months. Student’s t test. (H) Genes belonging to the K9/K27 chromatin state in 4-month WT mDA cells and up-regulated in KO mDA cells at 8 months but not at 4 months have reduced H3K9me3 surrounding their TSSs in KO mDA cells already at 4 months. (I) Genes belonging to the K9/K27 chromatin state in 4-month WT mDA cells and not up-regulated in KO mDA cells at 8 months do not have reduced K9 surrounding their TSSs at 4 months in 4-month KO mDA cells.
Fig. 4.
Fig. 4.. Reduced levels of TH and dopamine metabolites in the striatum and midbrain upon inactivation of PRC2.
(A to C) TH immunostaining in the striatum of DatCreEedwt/wt mice at 4 months (A), 8 months (B), and 16 months (C). (D to F) TH immunostaining and mCHERRY fluorescence in the ventral midbrain of DatCreEedwt/wt mice at 4 months (D), 8 months (E), and 16 months (F). (G to I) TH immunostaining in the striatum of DatCreEedfl/fl mice at 4 months (G), 8 months (H), and 16 months (I); arrow in (H) indicates reduced albeit detectable TH immunostaining in the nucleus accumbens. (J to L) TH immunostaining and mCHERRY fluorescence in the ventral midbrain of DatCreEedfl/fl mice at 4 months (J), 8 months (K), and 16 months (L). (M) Expression of eGFP in the striatum of DatCreEedwt/wt mice 21 days after injection of AAV-eGFP in the ventral midbrain. (N) Injection site of AAV-eGFP in DatCreEedwt/wt mice 21 days after injection. (O) eGFP expression in the striatum of DatCreEedfl/fl mice 21 days after injection of AAV-eGFP in the ventral midbrain. (P) Injection site of AAV-eGFP in DatCreEedfl/fl mice 21 days after injection. (Q) H3K27me3 immunostaining in mCHERRY+ cells in the SN of 8-month DatCreEedwt/wt mice. (R) No H3K27me3 immunostaining in mCHERRY+ cells in the SN of 8-month DatCreEedwt/wt mice. (S) Quantification of mCHERRY+ cells in the ventral midbrain of DatCreEedwt/wt and DatCreEedfl/fl mice at 8 months shows no loss of mCHERRY+ cells in mutant midbrains. nWT = 3 and nMUT = 3. (T) Reduced levels of dopamine metabolites in the ventral midbrain and striatum of DatCreEedfl/fl mice. nWT = 3 and nMUT = 3. In (T), *P < 0.05 and ***P < 0.001, unpaired t test with Welch’s correction. Scale bars, 1000 μm (O) and 50 μm (R). n.s., not significant.
Fig. 5.
Fig. 5.. Altered electrophysiological properties and animal behavior upon inactivation of PRC2.
(A) Reduced capacitance in 8-month DatCreEedfl/fl mDA neurons. (B) Increased membrane resistance in 8-month DatCreEedfl/fl mDA neurons. (C to E) Increased coefficient of variation (CV) of interspike intervals of autonomous pacemaker currents in 8-month DatCreEedfl/fl mDA neurons. (F and G) Decreased hyperpolarization current (Ih) in 8-month DatCreEedfl/fl mDA neurons. (H and I) Decreased slow AHC in 8-month DatCreEedfl/fl mDA neurons. (J and K) Action potential (AP) threshold is reduced (J), whereas AHP is decreased (K) in DatCreEedfl/fl mDA neurons. (L) Action potential amplitude was not significantly reduced in DatCreEedfl/fl mDA neurons. (M) Phase plot (dV/dt versus Vm) of action potential in DatCreEedwt/wt and DatCreEedfl/fl mDA neurons of the SNpc. (N to P) Open-field test at 4 months (N) (nWT = 10 and nMUT = 12), 8 months (O) (nWT = 19 and nMUT = 16), and 16 months (P) (nWT = 36 and nMUT = 14) shows a progressive decrease in distance moved by DatCreEedfl/fl mice. (Q) Progressive decrease in the number of rearings for DatCreEedfl/fl mice. nWT4 = 10, nMUT4 = 12, nWT8 = 18, nMUT8 = 16, nWT16 = 15, and nMUT = 12. (R) Progressive increase in total time needed for DatCreEedfl/fl mice to complete the pole test. nWT4 = 8, nMUT4 = 12, nWT8 = 17, nMUT8 = 16, nWT16 = 17, and nMUT = 15, average from five trials per mouse. (S) CPP score before and after exposure to cocaine in WT and mutant mice. nWT = 11 and nMUT = 10. In (A) to (M), the datasets were checked for normality with Shapiro-Wilk test. For normally distributed datasets, unpaired t test was used (*P < 0.05 and ****P < 0.0005). If the datasets did not pass the normality test, then Mann-Whitney test was applied. In (N) to (P), P values were calculated by two-way repeated-measures analysis of variance (ANOVA). In (Q) and (R), *P < 0.05 and ***P < 0.001 calculated by one-way ANOVA with Tukey’s multiple comparisons test. In (S), P values were calculated with paired t test.
Fig. 6.
Fig. 6.. Eed deficiency in 5HT neurons results in loss of H3K27me3 and progressive decrease in TPH2 expression.
(A) In situ hybridization for Slc6a4 (Sert) taken from the Allen Brain Atlas (mouse.brain-map.org, image credit: Allen Institute). (B) Immunostaining of H3K27me3 in mCHERRY+ 5HT neurons in the dorsal raphe of SertCreEedwt/wt mice. (C) Lack of H3K27me3 immunostaining in mCHERRY+ 5HT neurons in the dorsal raphe of SertCreEedfl/fl mice. (D to F) TPH2 immunostaining localized in mCHERRY+ 5HT neurons in the dorsal raphe of SertCreEedwt/wt mice aged 4 months (D), 8 months (E), and 16 months (F). (G to I) Progressive loss of TPH2 in 5HT neurons in the dorsal raphe of SertCreEedfl/fl mice aged 4 months (G), 8 months (H), and 16 months (I). Scale bars, 20 μm (C) and 200 μm (I).
Fig. 7.
Fig. 7.. Eed deficiency in 5HT neurons results in impaired 5HT-specific gene expression and function.
(A) Volcano plot showing DEGs in mCHERRY+ nuclei from SertCreEedfl/fl mutants at 8 months. Numbers of up- and down-regulated genes are indicated above the plot, with the number of H3K27me3+ genes in 8-month SertCreEedwt/wt 5HT neurons within brackets. Examples of up-regulated genes that are PRC2 targets in SertCreEedwt/wt 5HT neurons are labeled on right side of the plot. Examples of down-regulated 5HT identity genes are labeled on left side of the plot. (B) Enriched categories for up-regulated genes (red) (GO biological process) are characterized by activation of transcription and early developmental non-neuronal processes, whereas down-regulated genes (blue) show enrichment for raphe categories (Up in Allen Brain Atlas, as calculated in Enrichr). (C) Reduced levels of serotonin metabolites in the raphe and prefrontal cortex (PFC) of SertCreEedfl/fl mice. nWT = 6 and nMUT = 6. (D and E) Heatmap of time spent in indicated areas in EPM for SertCreEedwt/wt mice (D) and SertCreEedfl/fl mice (E). (F) Increased time spent in open area for SertCreEedfl/fl mice in EPM. nWT = 10 and nMUT = 16. (G) Increased number of visits to open area for SertCreEedfl/fl mice in EPM. nWT = 10 and nMUT = 16. (H) Enrichment/depletion of chromatin states (in 8-month WT 5HT neurons) of genes up-regulated in SertCreEedfl/fl mCHERRY+ nuclei at 8 months. (I) Overlap of up-regulated genes between 8-month DatCreEedfl/fl and SertCreEedfl/fl mice. (J) Commonly up-regulated genes in 8-month DatCreEedfl/fl and SertCreEedfl/fl mice are more enriched for the K9K/K27 chromatin state than the K4/K27 state. In (C), (F), and (G), *P < 0.05, **P < 0.01, and ***P < 0.001, unpaired t test with Welch’s correction.
Fig. 8.
Fig. 8.. mDA neurons of the SNpc exhibit selective increased vulnerability to loss of PRC2 activity.
(A) UMAP showing distribution of WT (black) and mutant (red) nuclei. (B) Composite average expression levels of mDA identity signature genes. (C) Classification of defined subgroups in UMAP space. ODC, oligodendrocyte. (D) Top: Hierarchical clustering of mDA neuron subgroups with identity classes defined as subgroup genotype. Bottom: Violin plots highlighting subtype-specific differences between genotypes based on the composite expression of the 25 most up-regulated genes in the mutant nuclei. (E) Number of DEGs in mutant nuclei of different mDA neuron groups according to (C). (F) Venn diagram showing overlap of up- and down-regulated genes in mutant nuclei from the combined VTA and SNpc. (G) Fold change of gene expression for the mutant versus WT DEGs, which are common between the VTA and SNpc. To normalize scales, the inverted fold change (−1/FC) is plotted for down-regulated genes. (H) UMAP visualization of Hoxd11 expression. (I) Composite average expression of mDA neuronal signature in WT (black) and mutant (red) nuclei for mDA neuron subgroups (VTA = VTA1 + VTA2 + VTA3). (J to M) Violin plots exemplifying genes up-regulated in both mutant SNpc and VTA (J), of genes more up-regulated in mutant SNpc than in mutant VTA (K), of genes only up-regulated in mutant SNpc and not in the VTA (L), and of genes only up-regulated in mutant VTA and not in SNpc (M). (N to P) Violin plots of pan-neuronal markers (N), of the SNpc marker Sox6 (O), and of the VTA marker Calb1 in WT (black) and mutant (red) SNpc and VTA nuclei (P). Wilcoxon rank sum test with Bonferroni corrections for adjusted P values. Adjusted P values are included in (D) and (I) to (P).

References

    1. Deneris E. S., Hobert O., Maintenance of postmitotic neuronal cell identity. Nat. Neurosci. 17, 899–907 (2014). - PMC - PubMed
    1. Holmberg J., Perlmann T., Maintaining differentiated cellular identity. Nat. Rev. Genet. 13, 429–439 (2012). - PubMed
    1. Bantignies F., Cavalli G., Cellular memory and dynamic regulation of polycomb group proteins. Curr. Opin. Cell Biol. 18, 275–283 (2006). - PubMed
    1. Di Croce L., Helin K., Transcriptional regulation by Polycomb group proteins. Nat. Struct. Mol. Biol. 20, 1147–1155 (2013). - PubMed
    1. Corley M., Kroll K. L., The roles and regulation of Polycomb complexes in neural development. Cell Tissue Res. 359, 65–85 (2015). - PMC - PubMed