Editorial
. 2022 Nov 2;3(6):490-501.
doi: 10.1158/2643-3230.BCD-22-0018.

Changes in Bone Marrow Tumor and Immune Cells Correlate with Durability of Remissions Following BCMA CAR T Therapy in Myeloma

Affiliations
Editorial

Changes in Bone Marrow Tumor and Immune Cells Correlate with Durability of Remissions Following BCMA CAR T Therapy in Myeloma

Kavita M Dhodapkar et al. Blood Cancer Discov. .

Abstract

Chimeric antigen-receptor (CAR) T cells lead to high response rates in myeloma, but most patients experience recurrent disease. We combined several high-dimensional approaches to study tumor/immune cells in the tumor microenvironment (TME) of myeloma patients pre- and post-B-cell maturation antigen (BCMA)-specific CAR T therapy. Lower diversity of pretherapy T-cell receptor (TCR) repertoire, presence of hyperexpanded clones with exhaustion phenotype, and BAFF+PD-L1+ myeloid cells in the marrow correlated with shorter progression-free survival (PFS) following CAR T therapy. In contrast, longer PFS was associated with an increased proportion of CLEC9A+ dendritic cells (DC), CD27+TCF1+ T cells with diverse T-cell receptors, and emergence of T cells expressing marrow-residence genes. Residual tumor cells at initial response express stemlike genes, and tumor recurrence was associated with the emergence of new dominant clones. These data illustrate a dynamic interplay between endogenous T, CAR T, myeloid/DC, and tumor compartments that affects the durability of response following CAR T therapy in myeloma.

Significance: There is an unmet need to identify determinants of durable responses following BCMA CAR T therapy of myeloma. High-dimensional analysis of the TME was performed to identify features of immune and tumor cells that correlate with survival and suggest several strategies to improve outcomes following CAR T therapy. See related commentary by Graham and Maus, p. 478. This article is highlighted in the In This Issue feature, p. 476.


Figures

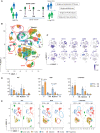
Figure 1. Cellular composition of the bone marrow and outcome following BCMA CAR T therapy. A, Overall approach—bone marrow mononuclear cells (BMMNC) were obtained from MM patients before and after therapy with BCMA CAR T therapy (4). CITE-seq/single-cell transcriptomics, mass cytometry, and T-cell receptor sequencing were performed on the samples. Data were correlated with progression-free survival (PFS) posttherapy. B, Uniform manifold approximation and projection (UMAP) graph for all cells sequenced. BMMNCs from pre- and posttreatment time points were thawed and analyzed together. The figure shows the result of unsupervised clustering of all sequenced BMMNCs based on the transcriptome. 63 distinct clusters could be identified. These clusters could be classified into T, NK, myeloid/DC, B, progenitors, and tumor cells. C, UMAP showing antibody staining for cell type markers to help classify clusters into tumor, T cells, NK, B, myeloid/DC, and progenitors. D, Mass cytometry: proportion of T, NK, myeloid, and B cells (as a proportion of nontumor cells in the marrow), plotted based on the time point of specimen collection and PFS. Bar graph shows the mean and SEM. E, UMAP based on the time point of specimen collection (pre, day 28, or 3 months) and PFS (<180 days or >180 days). Major differences posttherapy in patients with longer PFS are highlighted.
Figure 1.
Cellular composition of the bone marrow and outcome following BCMA CAR T therapy. A, Overall approach—bone marrow mononuclear cells (BMMNC) were obtained from MM patients before and after therapy with BCMA CAR T therapy (4). CITE-seq/single-cell transcriptomics, mass cytometry, and T-cell receptor sequencing were performed on the samples. Data were correlated with progression-free survival (PFS) posttherapy. B, Uniform manifold approximation and projection (UMAP) graph for all cells sequenced. BMMNCs from pre- and posttreatment time points were thawed and analyzed together. The figure shows the result of unsupervised clustering of all sequenced BMMNCs based on the transcriptome. 63 distinct clusters could be identified. These clusters could be classified into T, NK, myeloid/DC, B, progenitors, and tumor cells. C, UMAP showing antibody staining for cell type markers to help classify clusters into tumor, T cells, NK, B, myeloid/DC, and progenitors. D, Mass cytometry: proportion of T, NK, myeloid, and B cells (as a proportion of nontumor cells in the marrow), plotted based on the time point of specimen collection and PFS. Bar graph shows the mean and SEM. E, UMAP based on the time point of specimen collection (pre, day 28, or 3 months) and PFS (<180 days or >180 days). Major differences posttherapy in patients with longer PFS are highlighted.
Figure 2. Properties of T cells/CAR T cells and association with PFS. A, ViSNE representation of mass cytometry of BMMNCs from pre-/posttreatment time points. Nontumor cells are plotted to characterize individual components identified based on lineage markers. Cell proportions are shown as a percentage of the nontumor fraction. B, Heat map shows the expression of selected markers on two major subsets of CD8+ T cells. P2 accounts for the majority of T-cell expansion observed following CAR T infusion. C and D, Volcano plots showing DEGs in CD8+ CAR T (C) and non-CAR T cells (D) at day 28 by PFS. E, Volcano plot showing DEGs in CD8+ T cells at 3 months by PFS. F, UMAP showing T cells clustered based on the expression of antibodies and overlay of TCRs classified based on the degree of expansion. Heat map (right) shows the expression of selected markers based on the TCR expansion status (hyperexpanded clone: >10% of total TCRs; large clone: 1%–10% of total TCRs; medium clone: 0.1%–1% of total TCRs; small clone: >single TCR and <0.1% of total TCRs and single TCRs). G–H, Pie-chart showing the proportion of expanded clones in non-CAR (G) and CAR (H) T cells. I, Shannon diversity index of bone marrow T cells pretherapy, at D28 and at 3 months after CAR T cell therapy. J, Correlation between baseline TCR diversity and PFS (days).
Figure 2.
Properties of T cells/CAR T cells and association with PFS. A, ViSNE representation of mass cytometry of BMMNCs from pre-/posttreatment time points. Nontumor cells are plotted to characterize individual components identified based on lineage markers. Cell proportions are shown as a percentage of the nontumor fraction. B, Heat map shows the expression of selected markers on two major subsets of CD8+ T cells. P2 accounts for the majority of T-cell expansion observed following CAR T infusion. C and D, Volcano plots showing DEGs in CD8+ CAR T (C) and non-CAR T cells (D) at day 28 by PFS. E, Volcano plot showing DEGs in CD8+ T cells at 3 months by PFS. F, UMAP showing T cells clustered based on the expression of antibodies and overlay of TCRs classified based on the degree of expansion. Heat map (right) shows the expression of selected markers based on the TCR expansion status (hyperexpanded clone: >10% of total TCRs; large clone: 1%–10% of total TCRs; medium clone: 0.1%–1% of total TCRs; small clone: >single TCR and <0.1% of total TCRs and single TCRs). GH, Pie-chart showing the proportion of expanded clones in non-CAR (G) and CAR (H) T cells. I, Shannon diversity index of bone marrow T cells pretherapy, at D28 and at 3 months after CAR T cell therapy. J, Correlation between baseline TCR diversity and PFS (days).
Figure 3. Properties of myeloid cells/DCs and association with PFS. A, UMAP showing myeloid/DC cluster based on the transcriptome, and overlays showing expression of CD11b and CLEC9A in single cells. Myeloid cells/DCs were identified based on antibody staining for CD14, CD11b, CD11c, BDCA2, BDCA3, and CD33. B, Relative proportion of group 1 or 2 clusters based on the time point of specimen collection (pre, D28, or 3 months) and PFS (<180 days or >180 days). C, Heat map showing selected DEGs (left) and antibody staining (right) in clusters in groups 1 and 2. D, Expression of BAFF and PD-L1 on myeloid clusters. E, Volcano plot showing DEGs between myeloid cells in groups 1 and 2.
Figure 3.
Properties of myeloid cells/DCs and association with PFS. A, UMAP showing myeloid/DC cluster based on the transcriptome, and overlays showing expression of CD11b and CLEC9A in single cells. Myeloid cells/DCs were identified based on antibody staining for CD14, CD11b, CD11c, BDCA2, BDCA3, and CD33. B, Relative proportion of group 1 or 2 clusters based on the time point of specimen collection (pre, D28, or 3 months) and PFS (<180 days or >180 days). C, Heat map showing selected DEGs (left) and antibody staining (right) in clusters in groups 1 and 2. D, Expression of BAFF and PD-L1 on myeloid clusters. E, Volcano plot showing DEGs between myeloid cells in groups 1 and 2.
Figure 4. Properties of tumor cells and associations with PFS. A, Volcano plot showing top DEGs at baseline in tumors associated with long or short PFS. B, Pathway analysis of the top DEGs in A. C, UMAP of tumor cell clusters based on transcriptomes from pretreatment and D28 time points. D, Proportional representation of individual patient tumors in each of the clusters in B. Posttreatment samples coclustering together in cluster 9 are highlighted. E, Volcano plot of the top DEGs in cluster 9. F, Pathway analysis of the top DEGs in cluster 9. G, Evolution of tumors versus PFS. Bars show a proportional representation of subclusters at each of the time points within individual patients.
Figure 4.
Properties of tumor cells and associations with PFS. A, Volcano plot showing top DEGs at baseline in tumors associated with long or short PFS. B, Pathway analysis of the top DEGs in A. C, UMAP of tumor cell clusters based on transcriptomes from pretreatment and D28 time points. D, Proportional representation of individual patient tumors in each of the clusters in B. Posttreatment samples coclustering together in cluster 9 are highlighted. E, Volcano plot of the top DEGs in cluster 9. F, Pathway analysis of the top DEGs in cluster 9. G, Evolution of tumors versus PFS. Bars show a proportional representation of subclusters at each of the time points within individual patients.

Comment in

Comment on

References

    1. Cohen AD, Raje N, Fowler JA, Mezzi K, Scott EC, Dhodapkar MV. How to train your T cells: overcoming immune dysfunction in multiple myeloma. Clin Cancer Res 2020;26:1541–54. - PMC - PubMed
    1. Munshi NC, Anderson LD Jr, Shah N, Madduri D, Berdeja J, Lonial S, et al. . Idecabtagene vicleucel in relapsed and refractory multiple myeloma. N Engl J Med 2021;384:705–16. - PubMed
    1. Berdeja JG, Madduri D, Usmani SZ, Jakubowiak A, Agha M, Cohen AD, et al. . Ciltacabtagene autoleucel, a B-cell maturation antigen-directed chimeric antigen receptor T-cell therapy in patients with relapsed or refractory multiple myeloma (CARTITUDE-1): a phase 1b/2 open-label study. Lancet 2021;398:314–24. - PubMed
    1. Cohen AD, Garfall AL, Stadtmauer EA, Melenhorst JJ, Lacey SF, Lancaster E, et al. . B cell maturation antigen-specific CAR T cells are clinically active in multiple myeloma. J Clin Invest 2019;129:2210–21. - PMC - PubMed
    1. Samur MK, Fulciniti M, Aktas Samur A, Bazarbachi AH, Tai YT, Prabhala R, et al. . Biallelic loss of BCMA as a resistance mechanism to CAR T cell therapy in a patient with multiple myeloma. Nat Commun 2021;12:868. - PMC - PubMed

MeSH terms

Substances