

Evaluating interhemispheric connectivity during midline object recognition using EEG
- PMID: 36026515
- PMCID: PMC9417031
- DOI: 10.1371/journal.pone.0270949
Evaluating interhemispheric connectivity during midline object recognition using EEG
Abstract
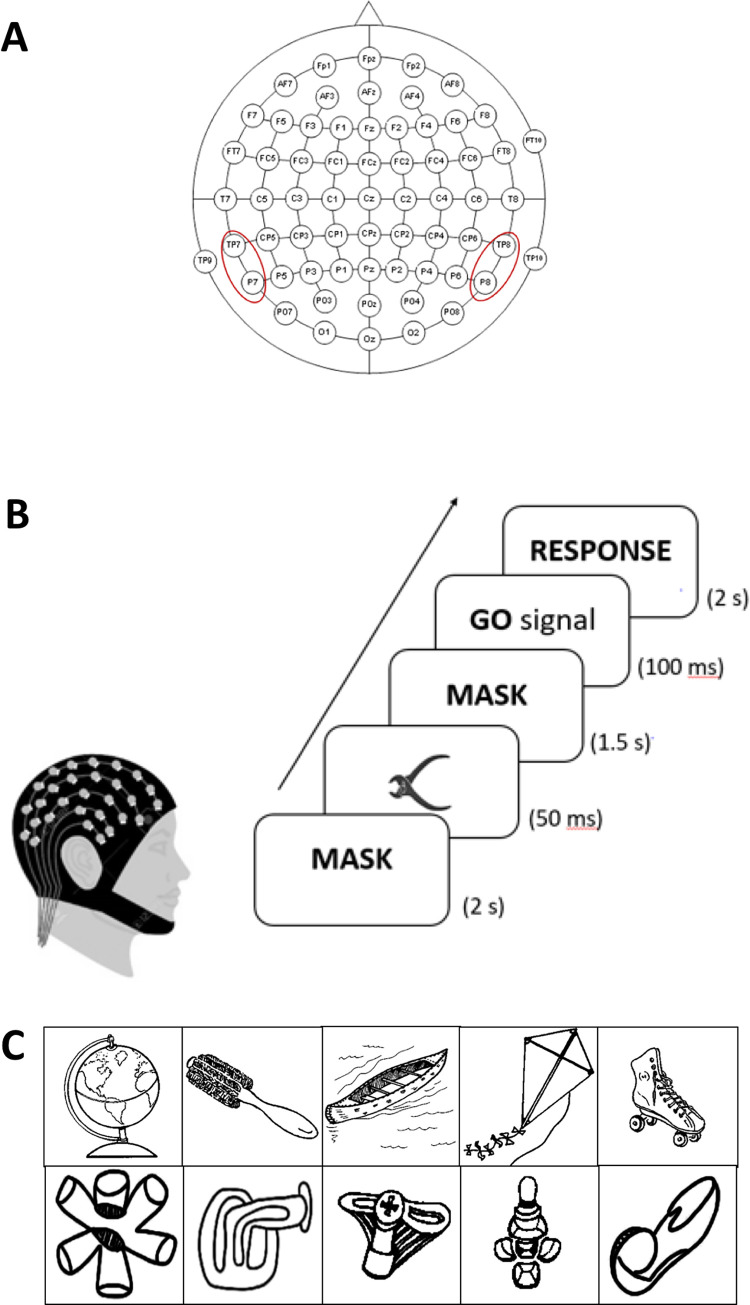
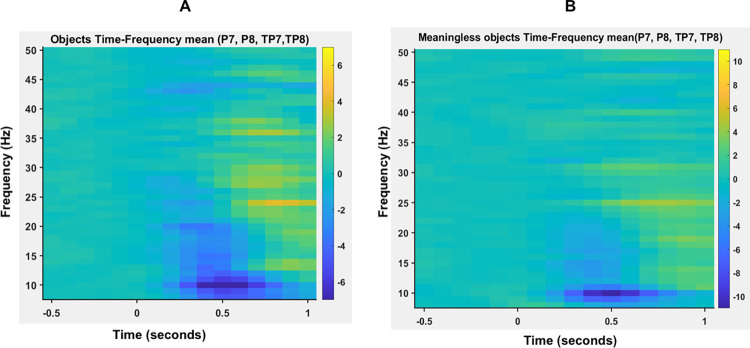
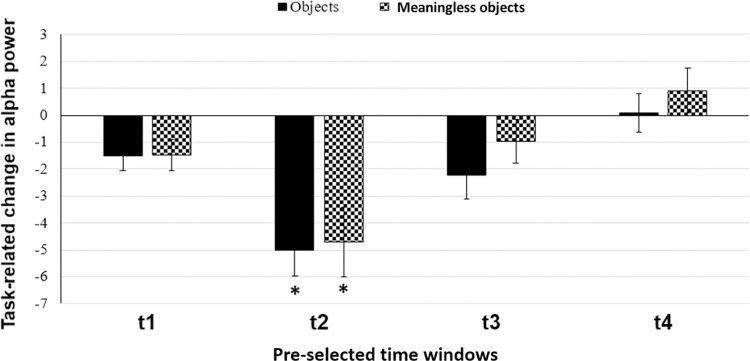
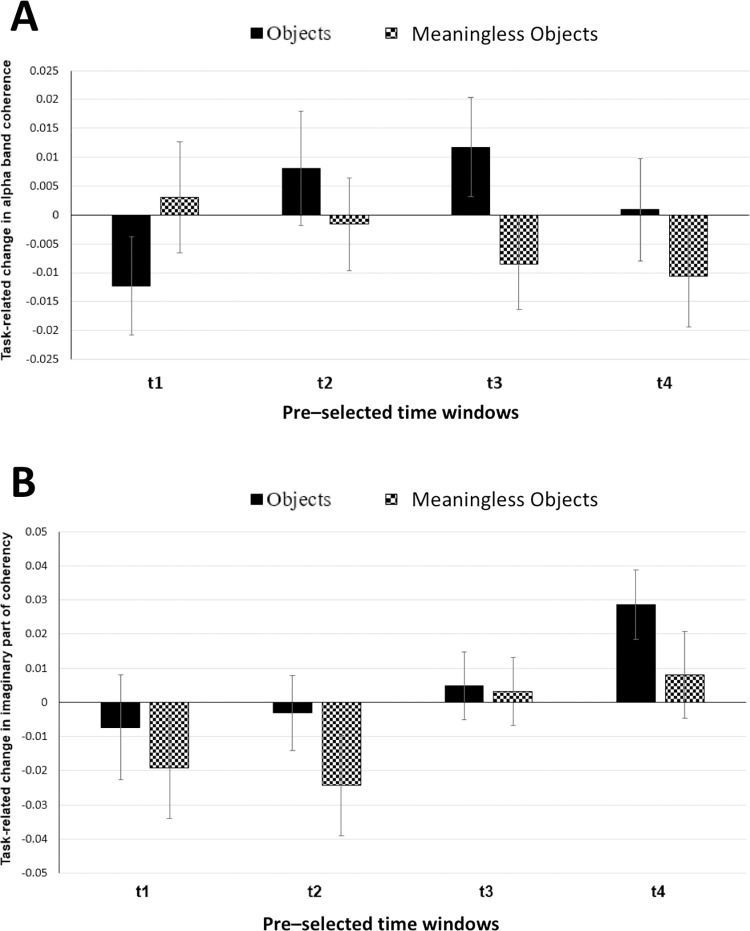
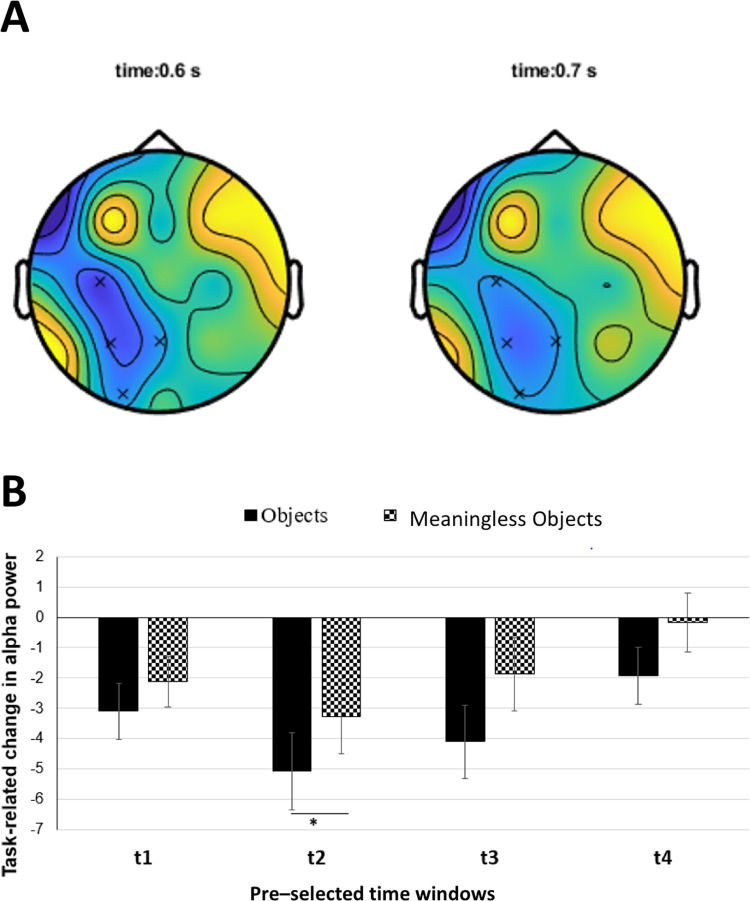
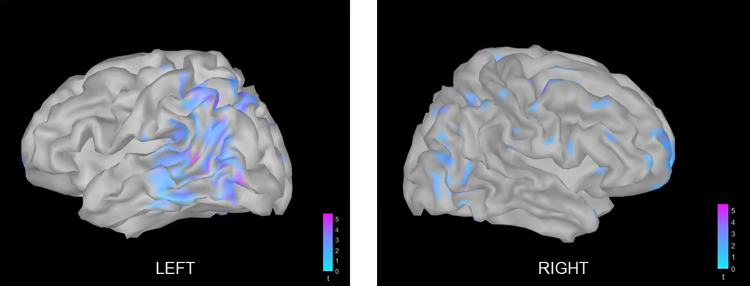
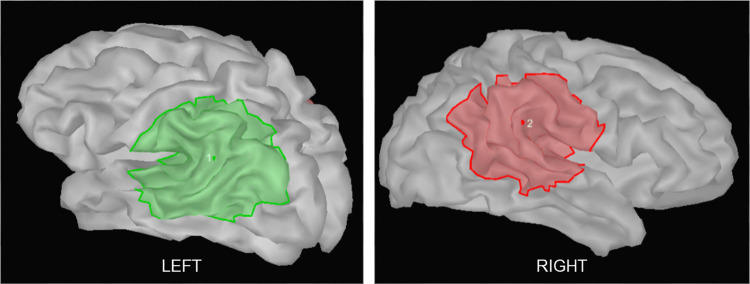
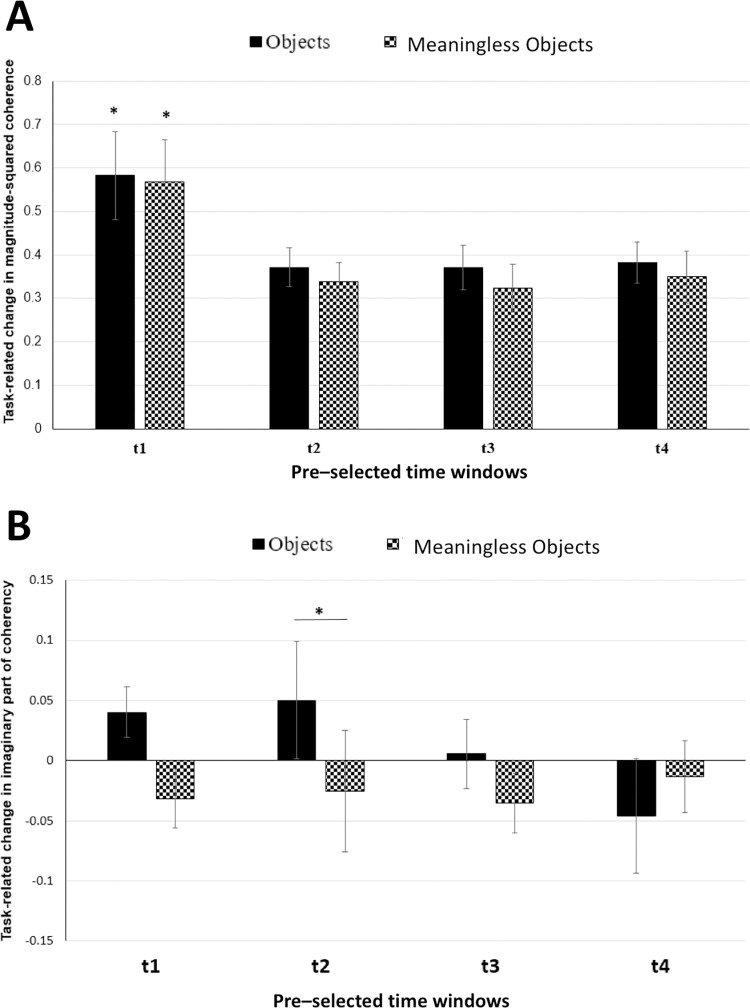
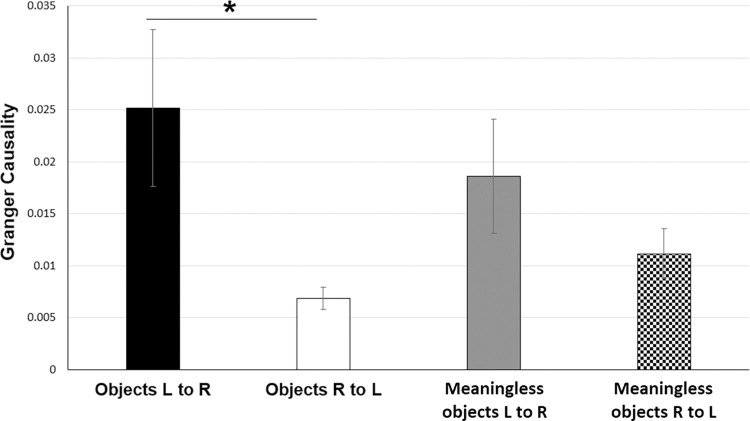
Functional integration between two hemispheres is crucial for perceptual binding to occur when visual stimuli are presented in the midline of the visual field. Mima and colleagues (2001) showed using EEG that midline object recognition was associated with task-related decrease in alpha band power (alpha desynchronisation) and a transient increase in interhemispheric coherence. Our objective in the current study was to replicate the results of Mima et al. and to further evaluate interhemispheric effective connectivity during midline object recognition in source space. We recruited 11 healthy adult volunteers and recorded EEG from 64 channels while they performed a midline object recognition task. Task-related power and coherence were estimated in sensor and source spaces. Further, effective connectivity was evaluated using Granger causality. While we were able to replicate the alpha desynchronisation associated with midline object recognition, we could not replicate the coherence results of Mima et al. The data-driven approach that we employed in our study localised the source of alpha desynchronisation over the left occipito-temporal region. In the alpha band, we further observed significant increase in imaginary part of coherency between bilateral occipito-temporal regions during object recognition. Finally, Granger causality analysis between the left and right occipito-temporal regions provided an insight that even though there is bidirectional interaction, the left occipito-temporal region may be crucial for integrating the information necessary for object recognition. The significance of the current study lies in using high-density EEG and applying more appropriate and robust measures of connectivity as well as statistical analysis to validate and enhance our current knowledge on the neural basis of midline object recognition.
Conflict of interest statement
The authors have declared that no competing interests exist.
Figures
Similar articles
-
Perceptual Integration Deficits in Autism Spectrum Disorders Are Associated with Reduced Interhemispheric Gamma-Band Coherence.J Neurosci. 2015 Dec 16;35(50):16352-61. doi: 10.1523/JNEUROSCI.1442-15.2015. J Neurosci. 2015. PMID: 26674862 Free PMC article.
-
Gamma coherence mediates interhemispheric integration during multiple object tracking.J Neurophysiol. 2020 May 1;123(5):1630-1644. doi: 10.1152/jn.00755.2019. Epub 2020 Mar 18. J Neurophysiol. 2020. PMID: 32186427
-
Transient interhemispheric neuronal synchrony correlates with object recognition.J Neurosci. 2001 Jun 1;21(11):3942-8. doi: 10.1523/JNEUROSCI.21-11-03942.2001. J Neurosci. 2001. PMID: 11356882 Free PMC article. Clinical Trial.
-
Dynamic reshaping of functional brain networks during visual object recognition.J Neural Eng. 2018 Oct;15(5):056022. doi: 10.1088/1741-2552/aad7b1. Epub 2018 Aug 2. J Neural Eng. 2018. PMID: 30070974
-
Domain-specific connectivity drives the organization of object knowledge in the brain.Handb Clin Neurol. 2022;187:221-244. doi: 10.1016/B978-0-12-823493-8.00028-6. Handb Clin Neurol. 2022. PMID: 35964974 Free PMC article. Review.
Cited by
-
Functional resilience of the neural visual recognition system post-pediatric occipitotemporal resection.iScience. 2024 Nov 22;27(12):111440. doi: 10.1016/j.isci.2024.111440. eCollection 2024 Dec 20. iScience. 2024. PMID: 39735436 Free PMC article.
References
-
- Gazzaniga M. S., Ivry R. B., and Mangun G. R., Cognitive Neuroscience: The Biology Of Mind (excerpt). 2008.
-
- Garson J. W., “(Dis)solving the binding problem,” Philosophical Psychology, vol. 14, no. 4, pp. 381–392, Dec. 2001, doi: 10.1080/09515080120088076 - DOI
Publication types
MeSH terms
Grants and funding
LinkOut - more resources
Full Text Sources
