. 2022 Nov 2;12(11):2606-2625.
doi: 10.1158/2159-8290.CD-21-1714.

Spatial Positioning and Matrix Programs of Cancer-Associated Fibroblasts Promote T-cell Exclusion in Human Lung Tumors

Affiliations

Spatial Positioning and Matrix Programs of Cancer-Associated Fibroblasts Promote T-cell Exclusion in Human Lung Tumors

John A Grout et al. Cancer Discov. .

Abstract

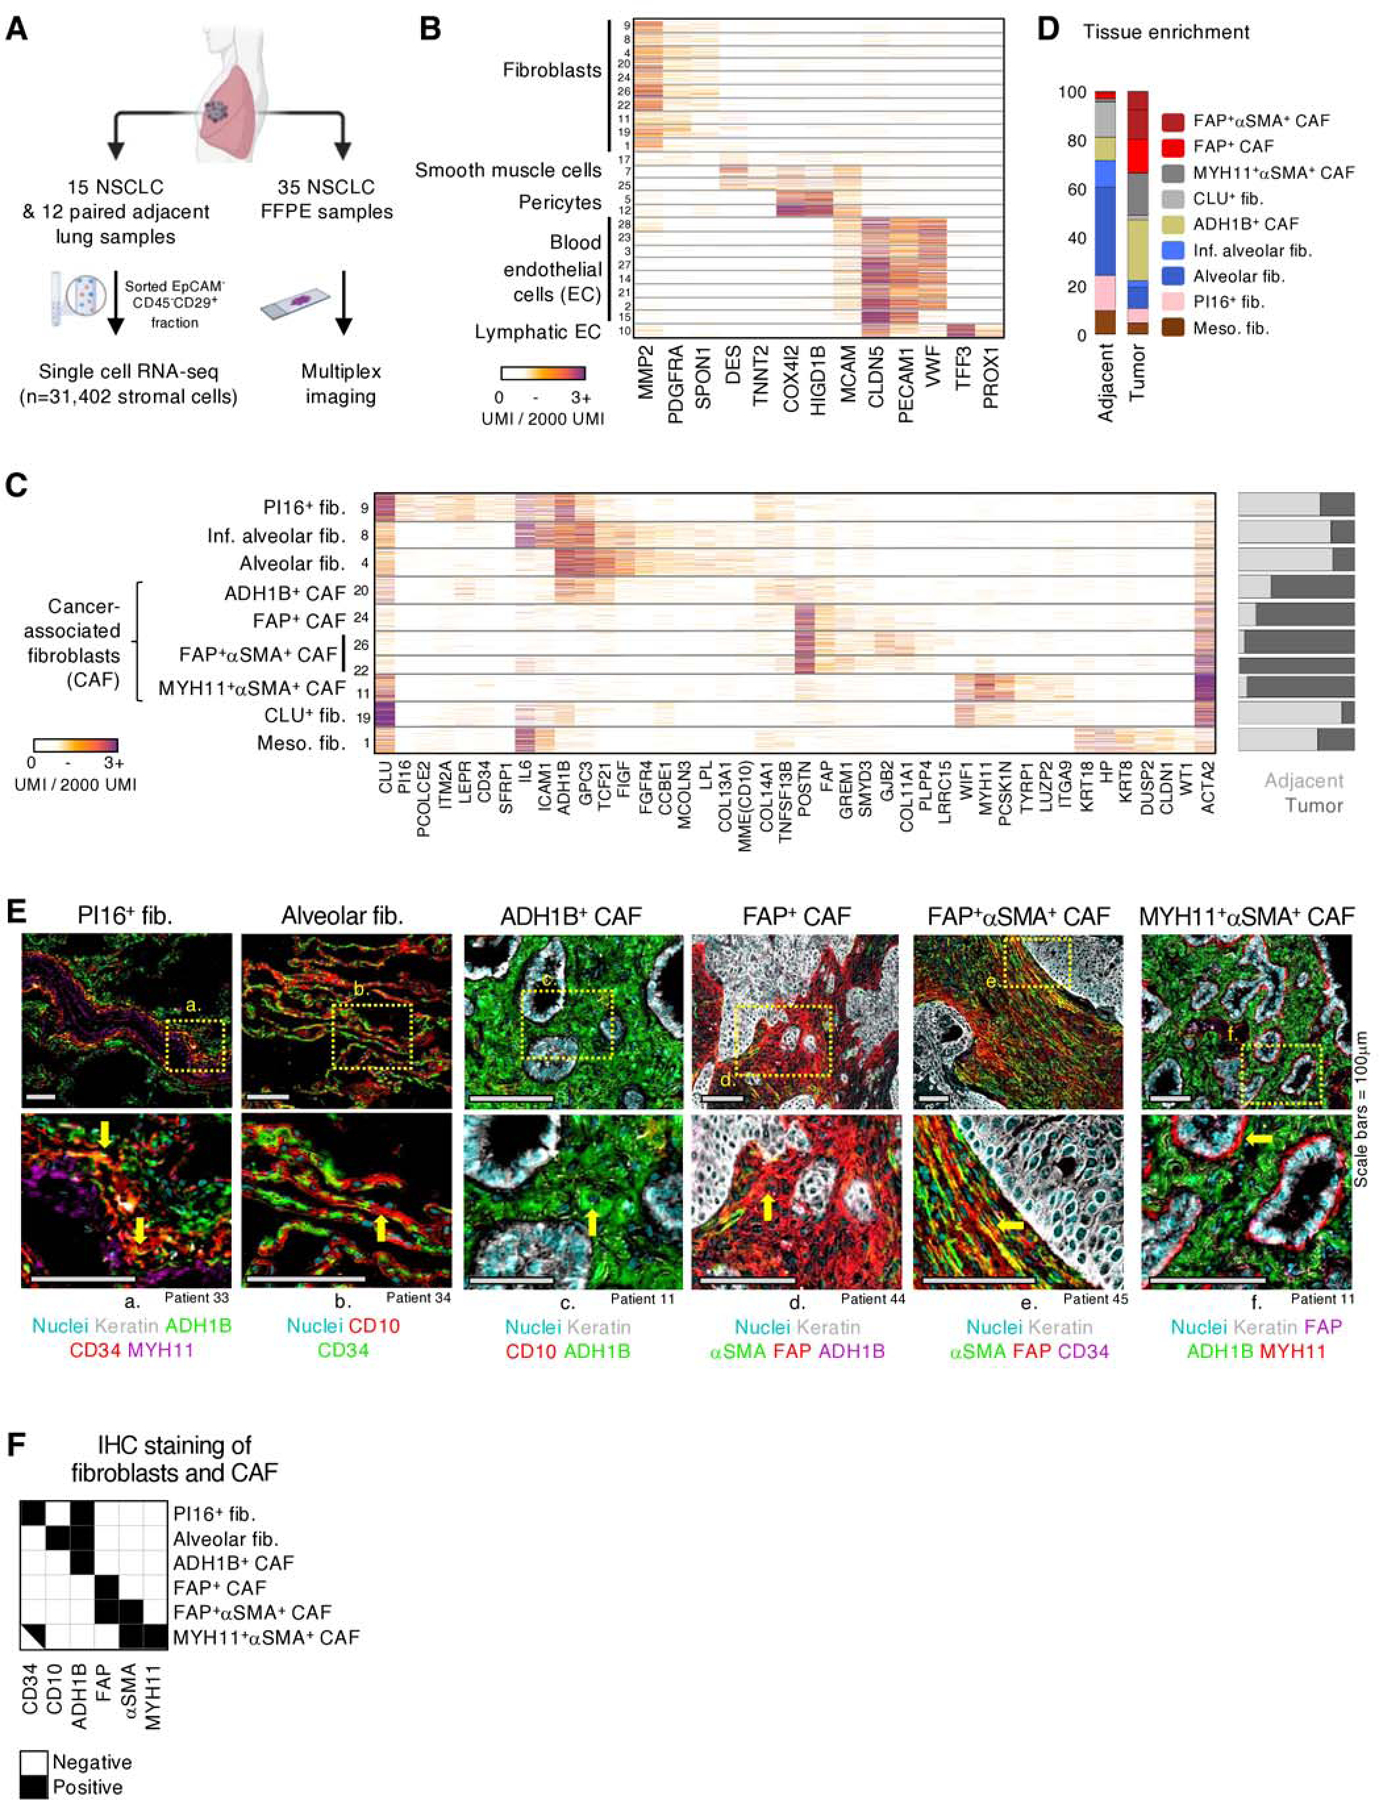
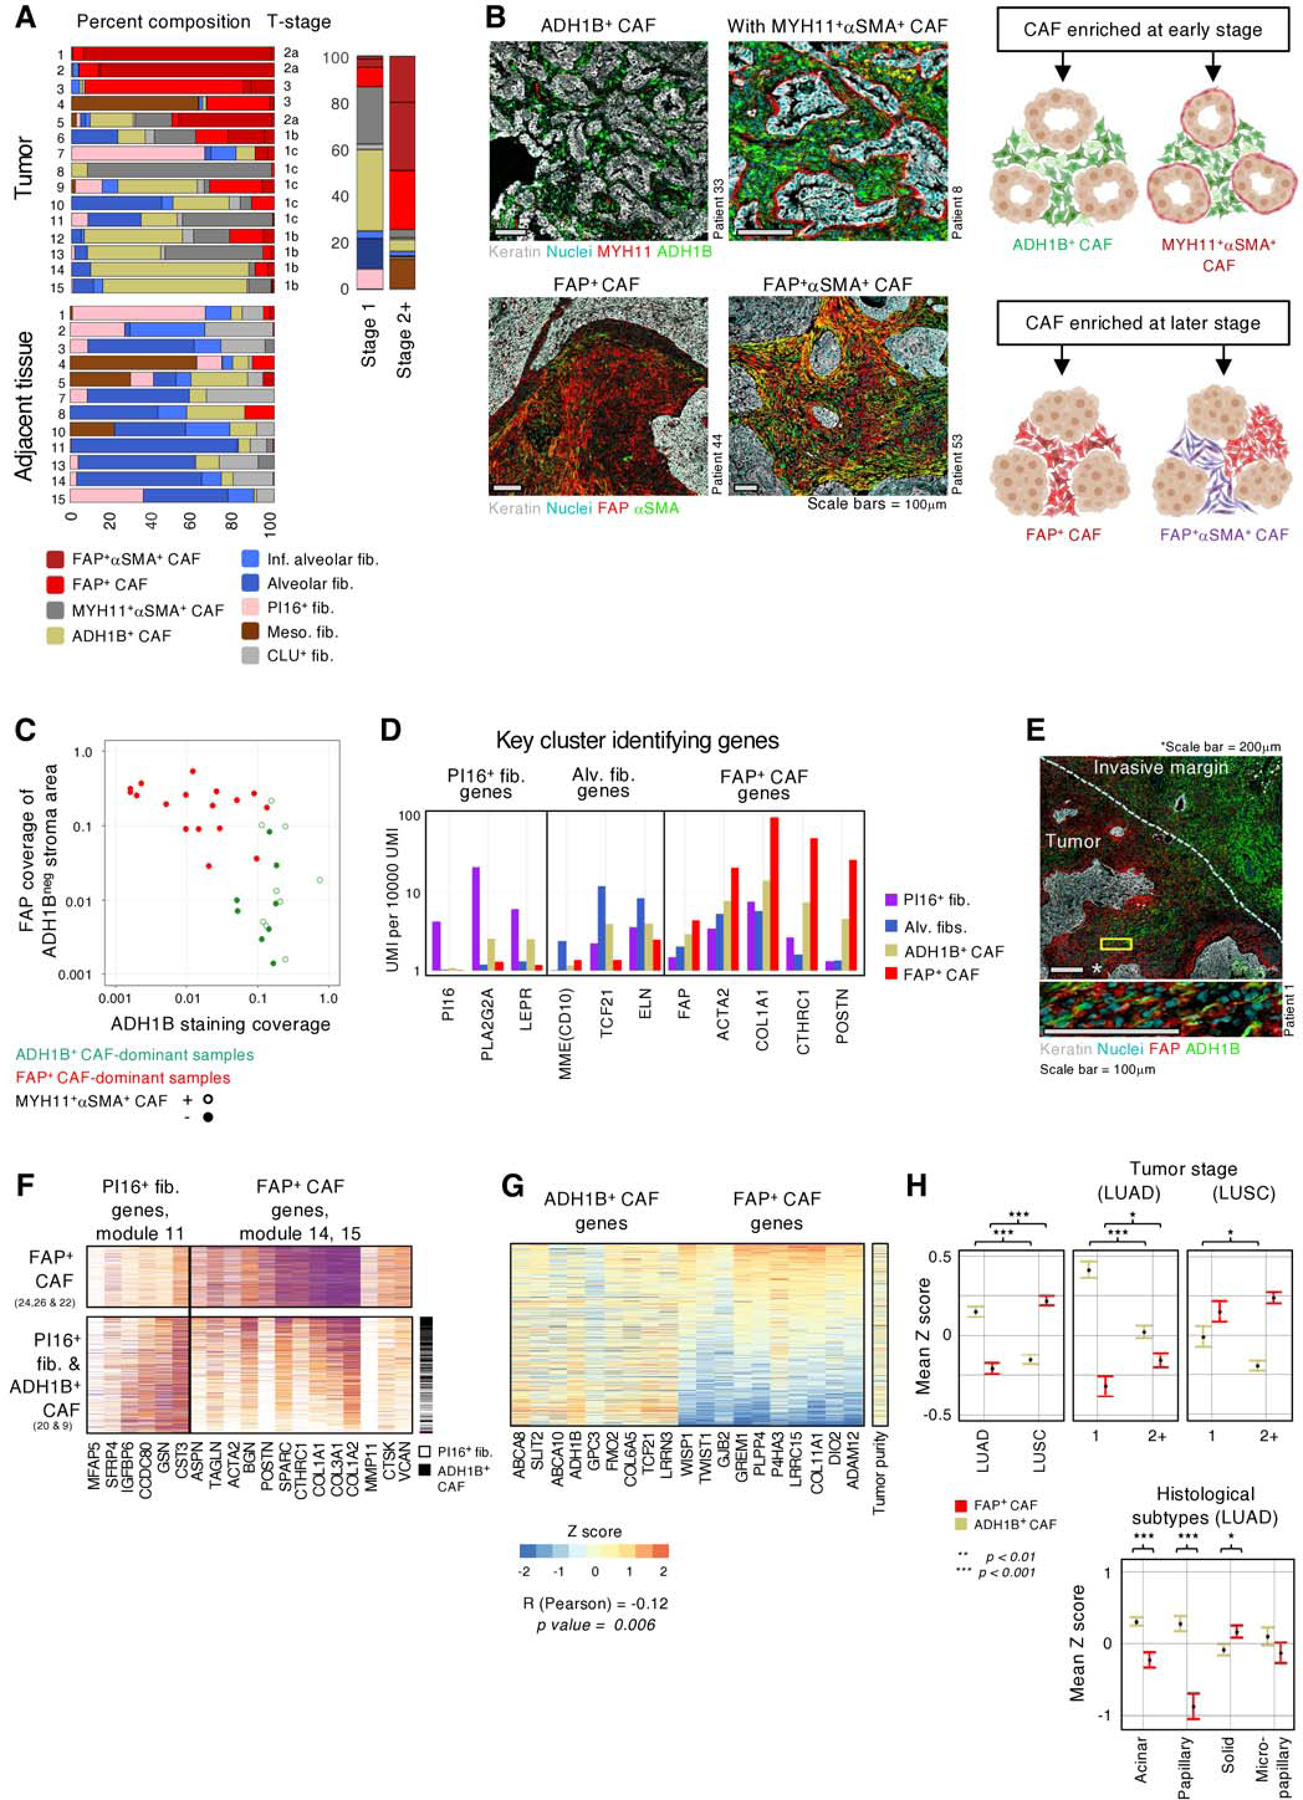
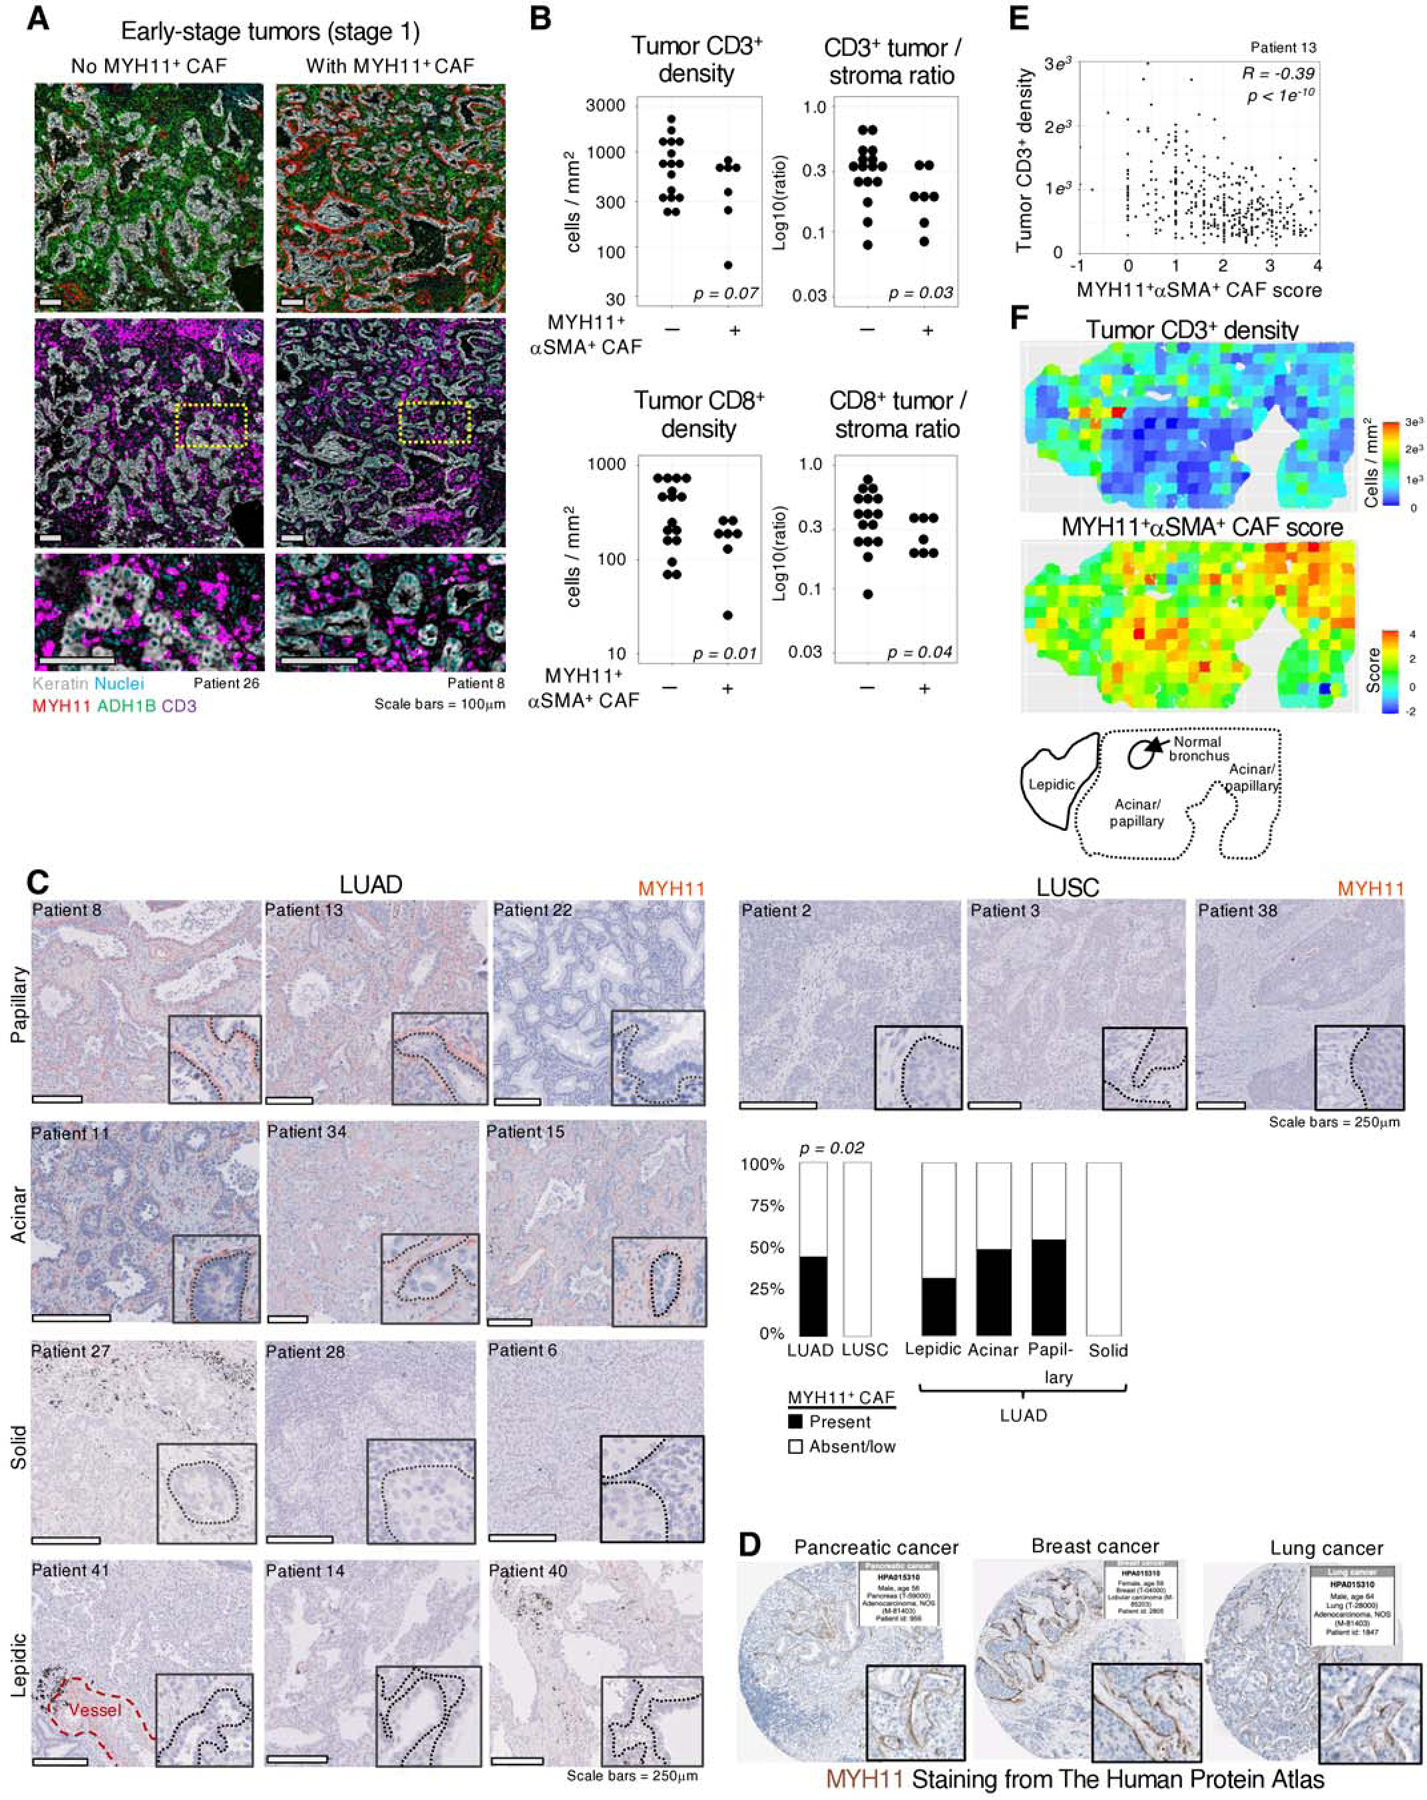
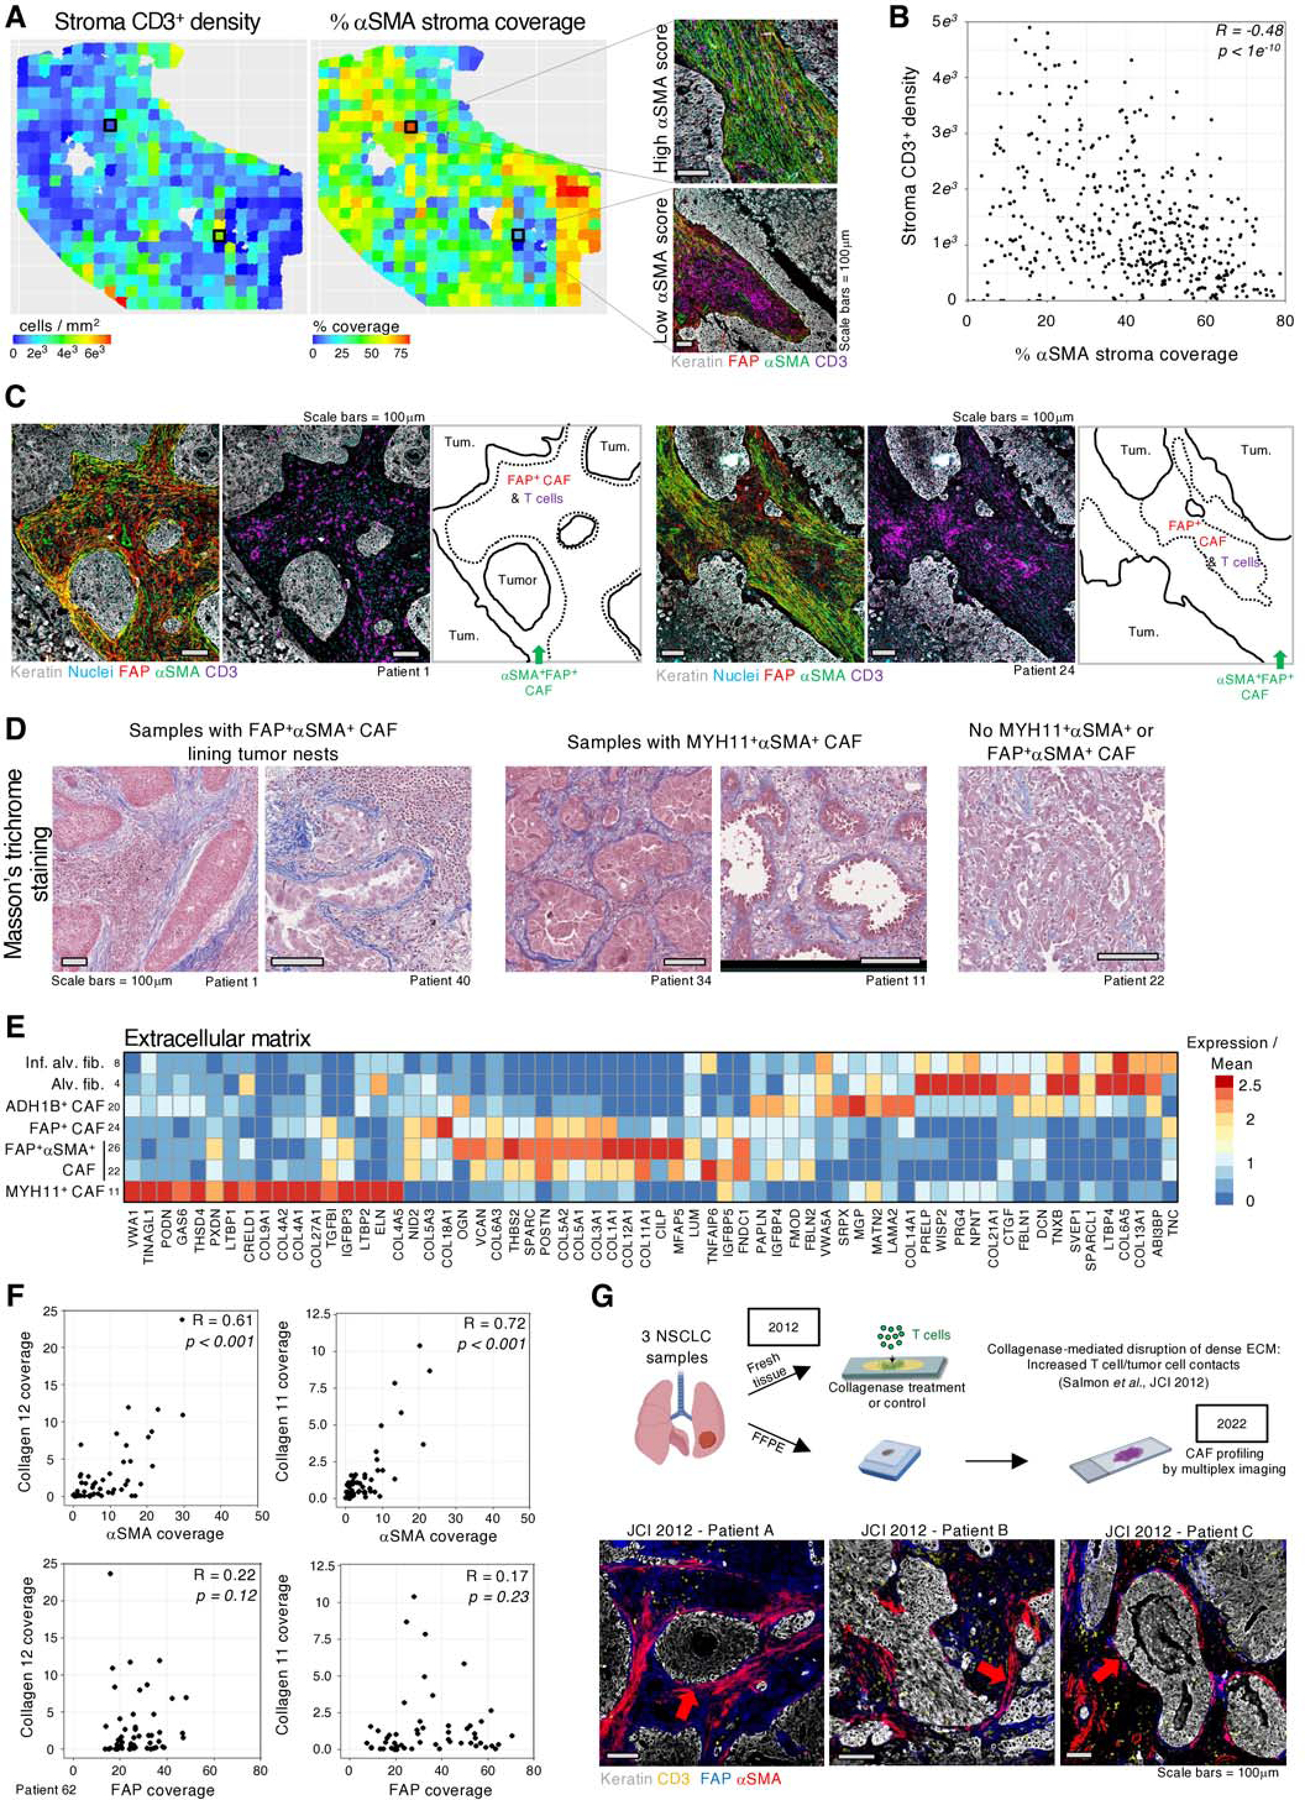
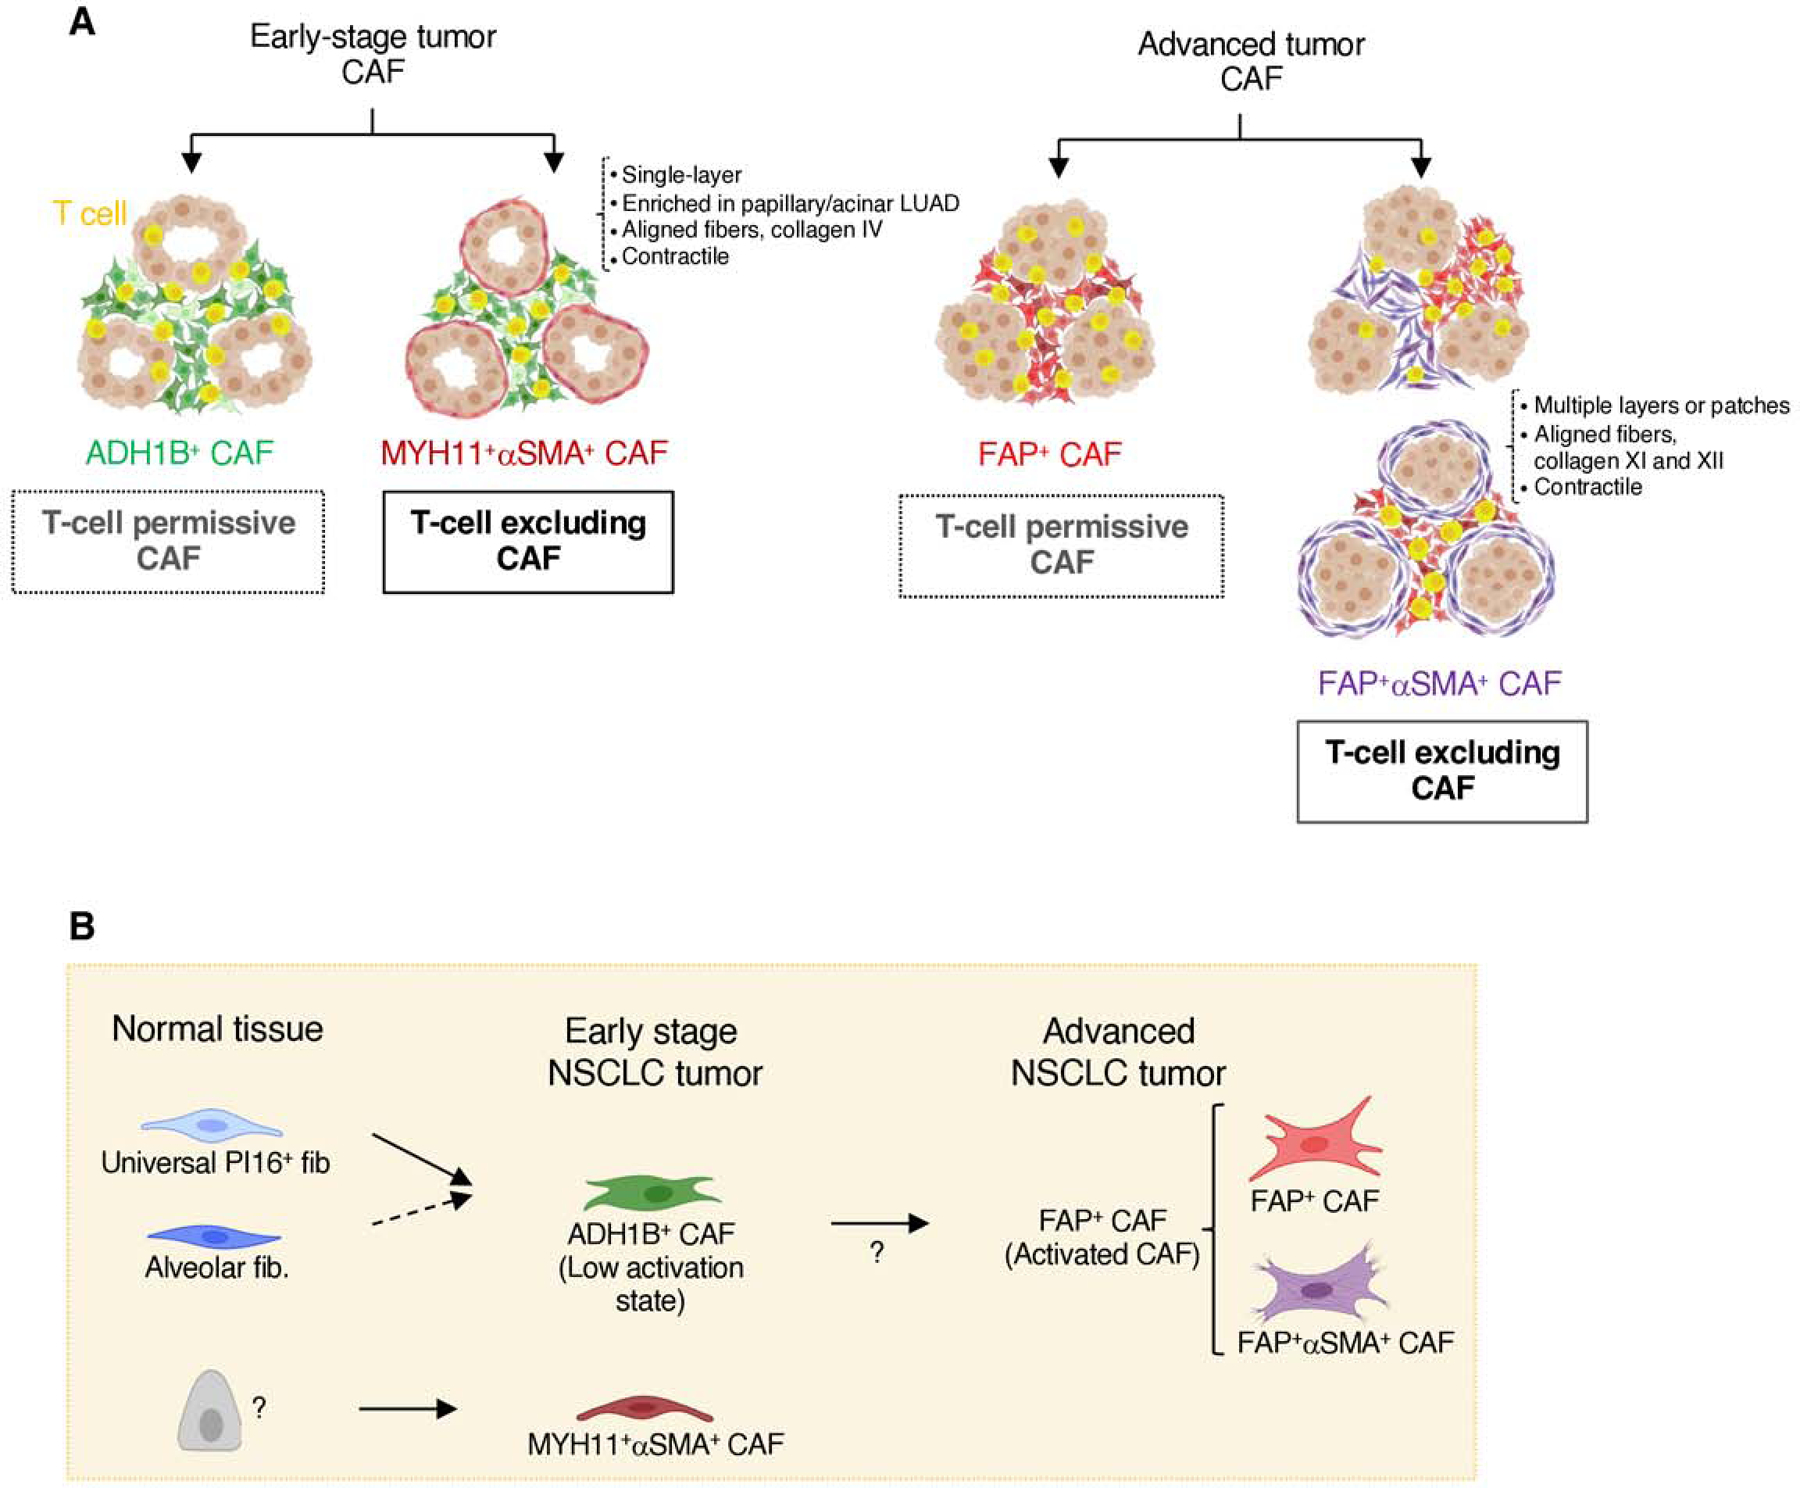
It is currently accepted that cancer-associated fibroblasts (CAF) participate in T-cell exclusion from tumor nests. To unbiasedly test this, we used single-cell RNA sequencing coupled with multiplex imaging on a large cohort of lung tumors. We identified four main CAF populations, two of which are associated with T-cell exclusion: (i) MYH11+αSMA+ CAF, which are present in early-stage tumors and form a single cell layer lining cancer aggregates, and (ii) FAP+αSMA+ CAF, which appear in more advanced tumors and organize in patches within the stroma or in multiple layers around tumor nests. Both populations orchestrate a particular structural tissue organization through dense and aligned fiber deposition compared with T cell-permissive CAF. Yet they produce distinct matrix molecules, including collagen IV (MYH11+αSMA+ CAF) and collagen XI/XII (FAP+αSMA+ CAF). Hereby, we uncovered unique molecular programs of CAF driving T-cell marginalization, whose targeting should increase immunotherapy efficacy in patients bearing T cell-excluded tumors.

Significance: The cellular and molecular programs driving T-cell marginalization in solid tumors remain unclear. Here, we describe two CAF populations associated with T-cell exclusion in human lung tumors. We demonstrate the importance of pairing molecular and spatial analysis of the tumor microenvironment, a prerequisite to developing new strategies targeting T cell-excluding CAF. See related commentary by Sherman, p. 2501. This article is highlighted in the In This Issue feature, p. 2483.


Conflict of interest statement

DECLARATION OF INTERESTS

Research support for this work was provided in part by Genentech, Inc. The authors declare no other competing financial interests.

Figures

Fig. 1 |
Fig. 1 |. Paired scRNAseq and IHC analysis identifies four CAF populations with distinct transcriptional profiles and structural organization in human NSCLC.
A, Tissue processing workflow for scRNAseq and IHC imaging of FFPE samples. B, scRNAseq mRNA counts (unique molecular identifiers, UMI) per cell (rows) of select stromal lineage marker genes (columns). Fibroblast, smooth muscle, pericyte, blood and lymphatic endothelial cell clusters are identified based on expression of marker genes such as, PDGFRA, DES, COX4I2, PECAM1, and TFF3, respectively. All cells displayed in this figure, and all subsequent similar scRNAseq figures, were downsampled to 2000 UMI. C, Extended gene lists highlighting gene expression profiles between the fibroblast subsets along with differing propensities for enrichment (right bar plot) in tumor (dark gray) or adjacent tissue (light gray). D, Averaged fibroblast composition in adjacent and tumor samples across all patients. The bar graph depicts the percentage of cells from each fibroblast subset among all fibroblasts. E, FFPE NSCLC sections were stained for fibroblast markers identified in scRNAseq results. All the scRNAseq-based fibroblast clusters (D) were detected utilizing IHC except meso. fib. and CLU+ fib., which were not in the scope of this study. Arrows highlight cells of interest (PI16+ fib.: CD34+ADH1B+MYH11neg, Alv. fib.: CD10+CD34neg, ADH1B+ CAF: ADH1B+CD10neg, FAP+ CAF: FAP+ADH1BnegαSMAneg; FAP+αSMA+ CAF: FAP+αSMA+CD34neg; MYH11+αSMA+ CAF: MYH11+FAPnegΑDH1Βneg). See Figure S3 for other stainings. All scale bars are 100μm. F, IHC staining presentation for the main identified fibroblast and CAF clusters.
Fig. 2 |
Fig. 2 |. Further characterization of CAF subsets in human NSCLC.
A, Stromal cell populations visualized with viSNE in CyTOF. EC, PvC and multiple fibroblast subsets can be distinguished with relatively few markers (CD10, CD31, CD34, CD73, FAP, CD146 and αSMA) B, (upper left panel) Highlighting CCL19 expressing cells within ADH1B+ CAF. These cells expressed high amounts of CCL19, CCL21, and VCAM1 and low levels of certain ADH1B+ CAF genes such as MYH10 and GPC3 (bottom and right panels). Multiplex IHC of a representative tertiary lymphoid structure. Podoplanin (PDPN) and CD20 marks follicular dendritic cells and B cells, respectively, in the B cell follicle, while the T cell zone is identified with CD3 staining. CCL19 and ADH1B staining show ADH1B+ fibroblasts surrounded by the secreted chemokine CCL19, specifically in the T cell zone. All scale bars are 100μm. C, Average expression of MHCII genes in each CAF subset. D, Average MHCII gene expression in classical antigen presenting cells, DC1, endothelial cells, and meso-like fibs. E, myCAF, iCAF and apCAF gene signatures (20,22) projected onto NSCLC CAF clusters.
Fig. 3 |
Fig. 3 |. ADH1B+ CAF and FAP+ CAF stratify NSCLC into two main stromal patterns associated with tumor stage and histology.
A, (left panel) Fibroblast subset composition, displayed by percentages, in individual tumor and adjacent tissue samples from the 15 scRNAseq patients. (right panel) Fibroblast distribution in stage 1 and stage 2+ tumors. The bar graph depicts the percentage of cells from each fibroblast subset among all fibroblasts. B, (Top left panels) ADH1B+ CAF rich patients showing ADH1B presence throughout the stroma. ADH1B+ CAF rich patients may present with (bottom left panel) or without (top left panel) a distinct single cell layer of MYH11+αSMA+ CAF at the tumor border. (Bottom left panels) FAP+ CAF rich patients with FAP staining throughout the stroma. The patients shown demonstrate the variable αSMA presentation in FAP+ cells. All scale bars are 100μm. (Right panels) Cartoon illustrating the observed presentation of multiple CAF subsets in NSCLC. C, ADH1B and FAP staining in the IHC cohort. ADH1B staining coverage in the stroma is shown on the X axis. FAP staining coverage in the stroma on regions that did not stain for ADH1B are shown on the Y axis. Tumors show significant preference for either ADH1B or FAP, with less than 5% coverage of the opposing stain. The 5% cutoff was selected after performing hypergeometric tests for 10 thresholds, at 5% increments, between 5% and 50%. The Bonferroni correction adjusted p value is 0.008. D, Mean expression of selected genes highlighting ADH1B+ CAF intermediate expression of PI16+ fib., alv. fib., and FAP+ CAF-associated genes. E, Tumor sample with an extensive invasive margin that displays a spectrum of ADH1B to FAP staining. (Zoom, bottom panel) Cells appearing to transition from ADH1B to FAP expression. Top panel scale bar is 200μm, bottom panel scale bar is 100μm. F, Expression of PI16+ fib. and FAP+ CAF module genes in PI16+ fib., ADH1B+ CAF, and FAP+ CAF. Based on gene expression patterns, ADH1B+ CAF appear to occupy an intermediate state of activation between PI16+ fib. and FAP+ CAF. G, Relative expression, displayed by Z score, of ADH1B+ CAF and FAP+ CAF-associated genes in TCGA LUAD bulk-RNAseq samples. ADH1B+ CAF and FAP+ CAF genes are significantly anticorrelated (Pearson) R = −0.12 and p = 0.006. The sample tumor nuclei count is used as a proxy of tumor purity and shows a relatively even distribution. H, TCGA LUAD mean Z score and standard error of mean (SEM) of ADH1B+ CAF and FAP+ CAF gene signatures stratified by tumor subtype (left and middle panels) or stage (right panel). Z score calculation is listed in methods and significance is calculated by independent t test (right panel).
Fig. 4 |
Fig. 4 |. ADH1B+ CAF and FAP+ CAF correlate with immune cell composition and not with T cell localization.
A, Gene expression over mean of highly variable immunomodulatory ligands in CAF clusters. B, Immune composition of scRNAseq tumor samples from (32). CAF phenotype is identified by IHC on the matched FFPE samples and then used to stratify samples. The relative abundance of each cell population within its respective compartment, i.e.; PD1+ T cells amongst all T cells, is calculated and then scaled across all tumors for the respective Z score value. LCAM score is significantly correlated with CAF phenotype (Pearson) R = 0.62, p = 0.01. C, Estimating the correlation between CAF phenotype and LCAM in TCGA LUAD samples. Each patients’ mean ADH1B+ CAF gene signature is subtracted from their mean FAP+ CAF gene signature and the resulting values are correlated with estimate LCAM score. The corresponding Pearson correlation values are shown. D, Schematic of QuPath methodology for tiling and T cell quantification. E, CD8+ cell infiltration into tumor nests in each patient (columns). Each point represents an individual 1000μm x 1000μm tile (all other tiling is 500μm x 500μm). F, IHC quantification of the tumor / stroma CD3+ or CD8+ cells per mm2 ratio. Tumor samples are stratified by their stroma profile (ADH1B+ CAF rich or FAP+ CAF rich) and no significant difference (t test) was observed.
Fig. 5 |
Fig. 5 |. MYH11+αSMA+ CAF are correlated with decreased T cell infiltration in tumor nests.
A, Representative examples of IHC stains from NSCLC tumors with and without MYH11+αSMA+ CAF present, showing CD3+ cell exclusion from tumor nests when MYH11+αSMA+ CAF are present. B, The presence or absence of MYH11+αSMA+ CAF demonstrates significant differences in tumor infiltrating CD3+ or CD8+ cells per mm2 (left) and the ratio of CD3+ or CD8+ cells per mm2 in the tumor versus stroma (right). Only early stage (tumor stage 1) patients were included to eliminate bias due to MYH11+αSMA+ CAF rarely being found at later stage. C, Representative images of MYH11 staining in multiple pathologies and histological subtypes. All scale bars are 250μm. (Barplot) MYH11+αSMA+ CAF distribution in different pathologies and histological subtypes in NSCLC. Significance determined by t test. D, MYH11 staining from The Human Protein Atlas. E, Quantification of 500×500μm tiles of both MYH11+αSMA+ CAF score, estimating tumor proximity of MYH11+αSMA+ cells by quantifying their enrichment within 10μm from tumor cells versus regions 20μm-30μm from tumor cells, and tumor infiltrating CD3+ cells per mm2. A high MYH11+αSMA+ CAF score is significantly anti-correlated (Pearson) with the number of tumor infiltrating CD3+ cells relative to the stroma. F, Visualization of the tiling described in E. (Bottom panel) Histological scoring of a tumor lesion highlighting that a high MYH11+αSMA+ CAF score is associated more with acinar/papillary phenotype, rather than lepidic.
Fig. 6 |
Fig. 6 |. FAP+αSMA+ CAF define patterns of poor T cell infiltration within tumor lesions.
A, (Left panel) Intra-tumoral heterogeneity of αSMA coverage (middle panel) and CD3+ cell density in the stroma in 500×500μm tiles. (Right panel) Representative examples of tiles showing regions with high or low levels of αSMA. B, Quantification of αSMA coverage and CD3+ density in each tile (points) as defined in A, showing a significant anticorrelation (Pearson) of αSMA coverage and CD3+ cell density. C, Dense αSMA staining at tumor border associates with decreased CD3+ cell abundance. The green arrow highlights border regions with high αSMA and low CD3+ cells. D, Masson’s trichrome stains highlighting increased ECM at the tumor boundary in samples containing MYH11+αSMA+ or FAP+αSMA+ CAF. E, Averaged gene expression of highly variable ECM genes in CAF clusters. F, αSMA coverage of the stroma is significantly correlated (Spearman) with collagen XI and XII deposition, while FAP+ CAF show no correlation. G, (top panel) Our prior work in (7) showed that collagenase treatment of viable slices of NSCLC tumor tissue increased T cell access to tumor cells. FFPE sections from tumor samples of the same three patients were stained by multiplex IHC for markers of CAF identified in the present study. (bottom panel) FAP is found throughout the stroma and αSMA shows increased expression at the tumor border.
Fig. 7 |
Fig. 7 |. Working model.
A, Graphical illustration of all stroma presentations found in this study. NSCLC samples enriched in ADH1B+ CAF throughout the stroma can be found with or without a single-cell layer of MYH11+αSMA+ CAF lining tumor cell aggregates. Those with MYH11+αSMA+ CAF show increased T cell exclusion from the tumor nests. NSCLC samples enriched in FAP+ CAF are found with variable abundance of FAP+αSMA+ CAF. Stromal regions with high αSMA have reduced T cell accumulation, and tumor nests surrounded by several layers of FAP+αSMA+ CAF show a lower T cell infiltration. B, Cartoon depicting the general distribution of fibroblast and CAF populations in adjacent lung tissue, early-stage NSCLC and advanced NSCLC, as well as the potential differentiation trajectories.

Comment in

References

    1. Ferlay J, Soerjomataram I, Dikshit R, Eser S, Mathers C, Rebelo M, et al. Cancer incidence and mortality worldwide: Sources, methods and major patterns in GLOBOCAN 2012. Int J Cancer 2015;136:E359–86. - PubMed
    1. Borghaei H, Paz-Ares L, Horn L, Spigel DR, Steins M, Ready NE, et al. Nivolumab versus Docetaxel in Advanced Nonsquamous Non–Small-Cell Lung Cancer. New Engl J Medicine 2015;373:1627–39. - PMC - PubMed
    1. Galon J, Bruni D. Approaches to treat immune hot, altered and cold tumours with combination immunotherapies. Nat Rev Drug Discov 2019;18:197–218. - PubMed
    1. Chen DS, Mellman I. Elements of cancer immunity and the cancer–immune set point. Nature 2017;541:321–30. - PubMed
    1. Herbst RS, Soria J-C, Kowanetz M, Fine GD, Hamid O, Gordon MS, et al. Predictive correlates of response to the anti-PD-L1 antibody MPDL3280A in cancer patients. Nature 2014;515:563–7. - PMC - PubMed

Publication types